Dashboard
The dashboard shows the DNS Protection setup assistant, a usage summary, a graph of the DNS Protection traffic, and a table highlighting the number of queries for the top domains in the last seven days.
To see these details, go to My Products > DNS Protection > Dashboard.
Note
The data in the dashboard is 15 to 25 minutes behind real-time.
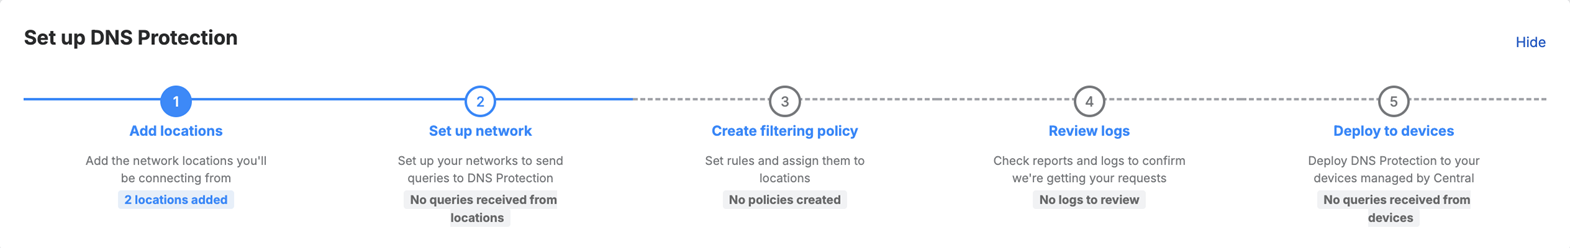
Set up DNS Protection
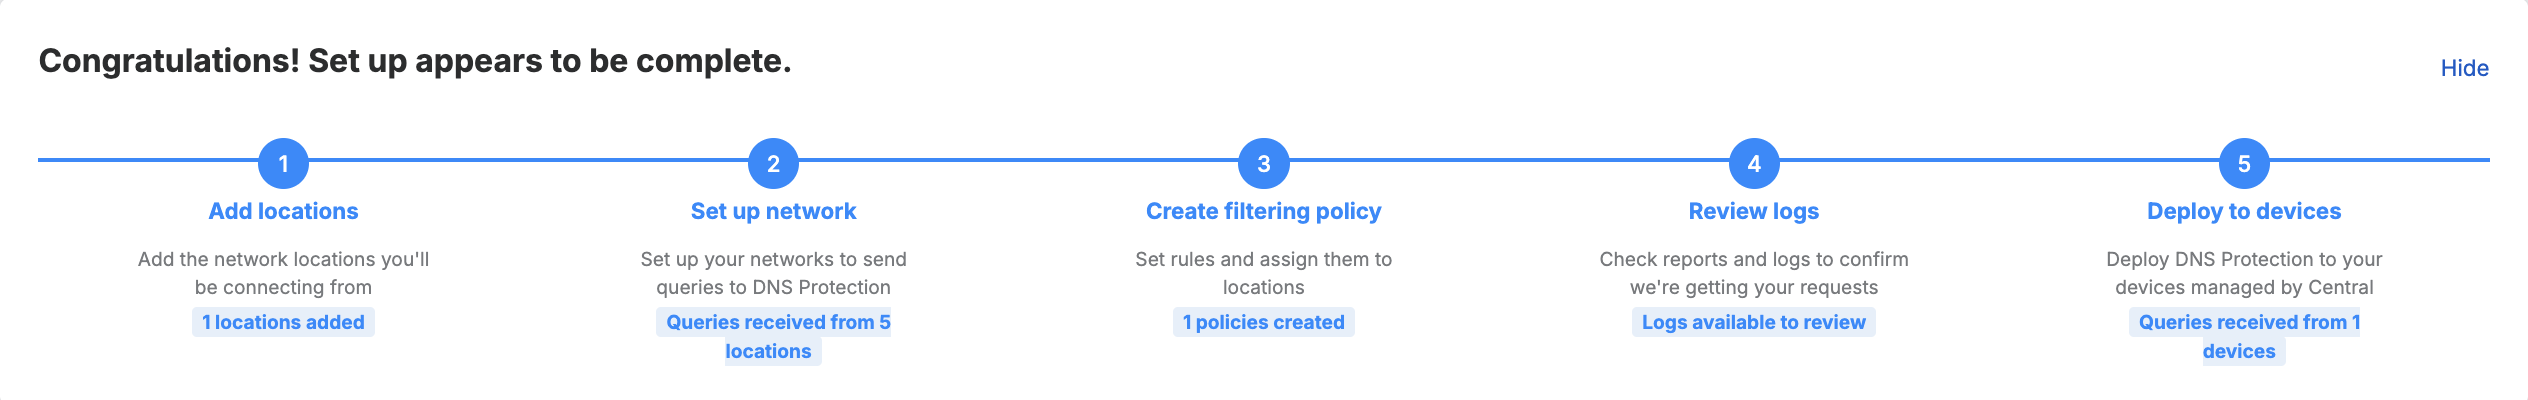
The Set up DNS Protection assistant helps you configure the initial steps to use DNS protection. It shows the status of each step as you progress through the assistant.

To use the assistant, do as follows:
-
Click Add locations.
This redirects you to My Products > DNS Protection > Locations. A default location is already added. To add more locations, see Add a location.
-
Click Dashboard to go back to the assistant.
You can see the number of locations you've added:
-
Click Set up your network.
This redirects you to the Installers page.
Do as follows:
- Copy the DNS Protection IP addresses and download the root certificate. See Installers.
- Set up your network as described in Set up your network.
-
After you've set up the network, click Dashboard to go back to the assistant.
You can see the number of locations from which queries are received:
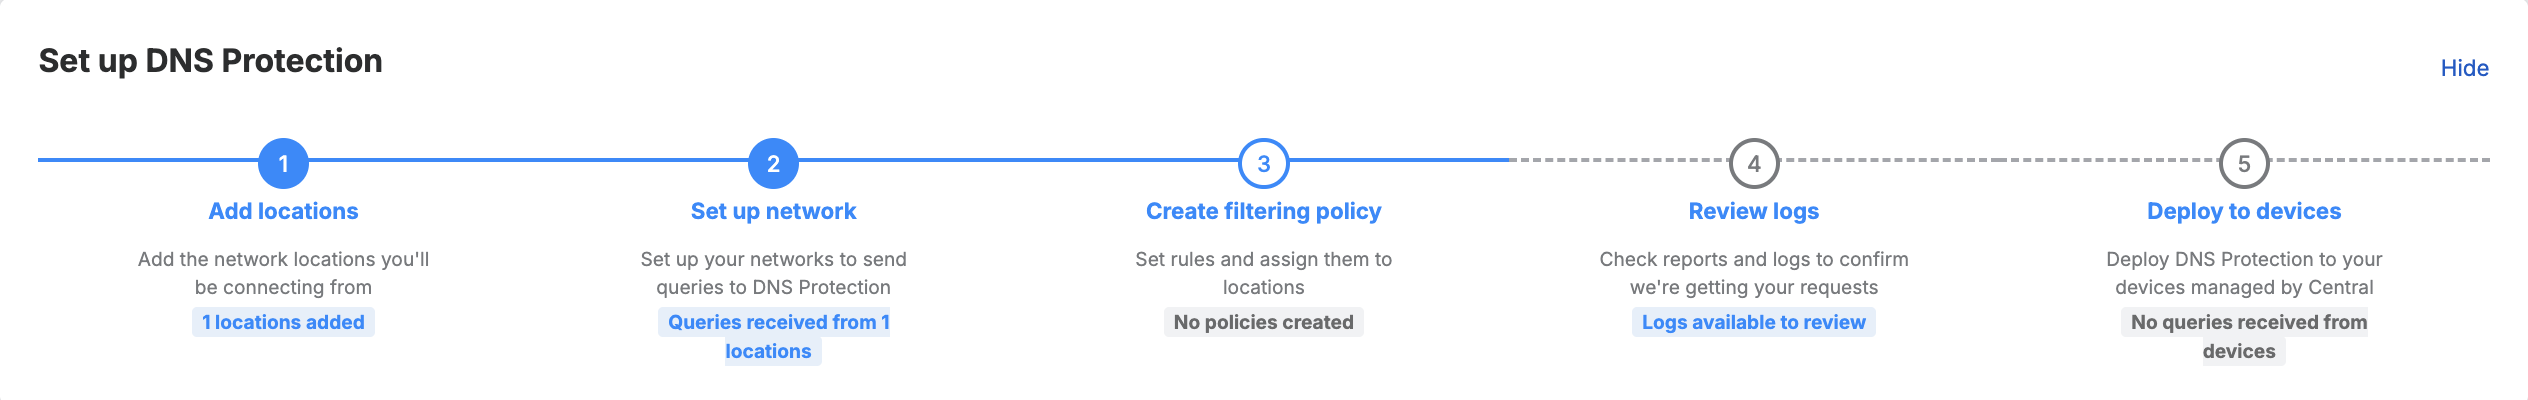
This data is for the number of active locations in the last three months. So, if you delete some locations, the number here might still include the locations you deleted.
-
Click Create policy.
This redirects you to My Products > DNS Protection > Policies. To add policies, see Add a filtering policy.
-
Click Dashboard to go back to the assistant.
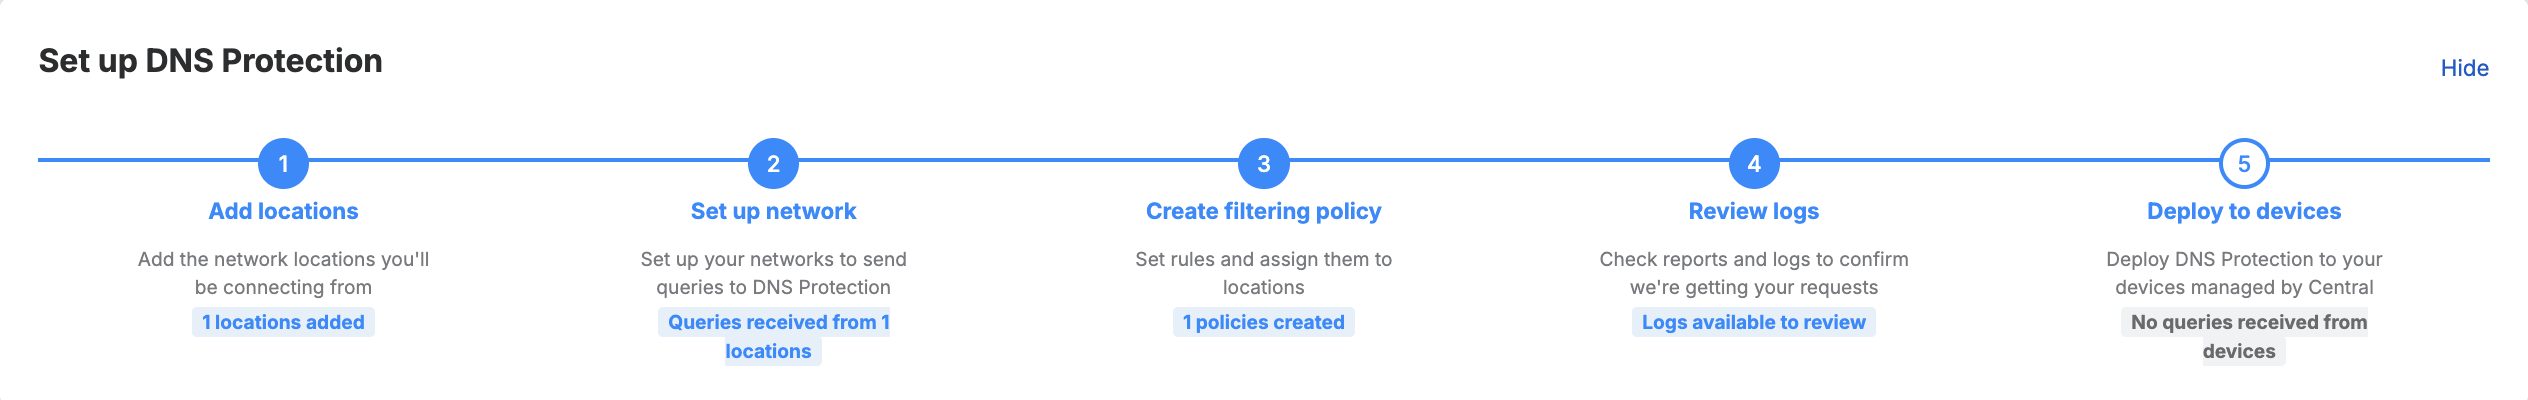
You can see the number of policies you've added:
-
Click Review logs.
This redirects you to My Products > DNS Protection > Logs & Reports. See Logs & Reports.
-
Click Dashboard to go back to the assistant and click Deploy to devices.
This redirects you to My Products > DNS Protection > Policies > Endpoint policies. To set up DNS Protection on your devices, see Configure Endpoint policy.
-
Click Dashboard to go back to the assistant.
When your setup is complete, you can see the Congratulations! Set up appears to be complete message.
-
In the top right, click Hide to hide the assistant.
To see the assistant again, any time, click Set up DNS Protection.
DNS Protection usage summary
Usage summary includes the following details:
- Total DNS queries: Number of DNS requests resolved (allowed or blocked) from all the locations.
- Security threats blocked: Number of DNS requests blocked for security reasons.
- Policy violations blocked: Number of DNS requests blocked by your policies. This doesn't include security blocks.
- Active computers: Number of active computers in the past 24 hours. You can see this number only if you're using Sophos Endpoint.
- Active locations: Number of locations from which we have received a DNS query at least once.
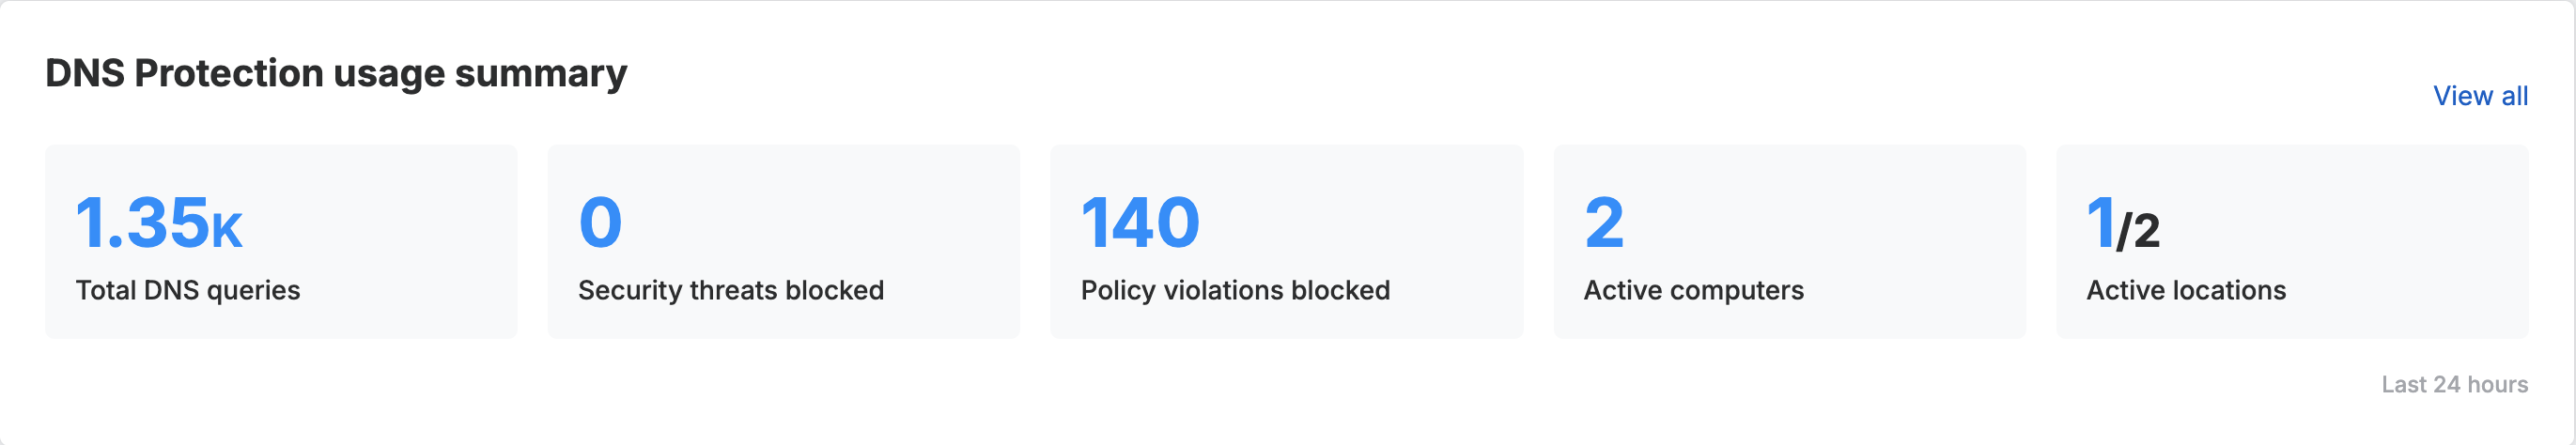
You can click each usage summary detail to see its report for the last 24 hours. Click View all to see and generate more reports. These links redirect you to the Logs & Reports page.
DNS query volume
This chart shows the number of DNS queries over time. You can see the number of queries for the previous 3 hours, 24 hours, or 30 days. You can compare the traffic to Last week or Last month (4 weeks ago). If you select 24 hours or 30 days, you can see the daily average for the last month.
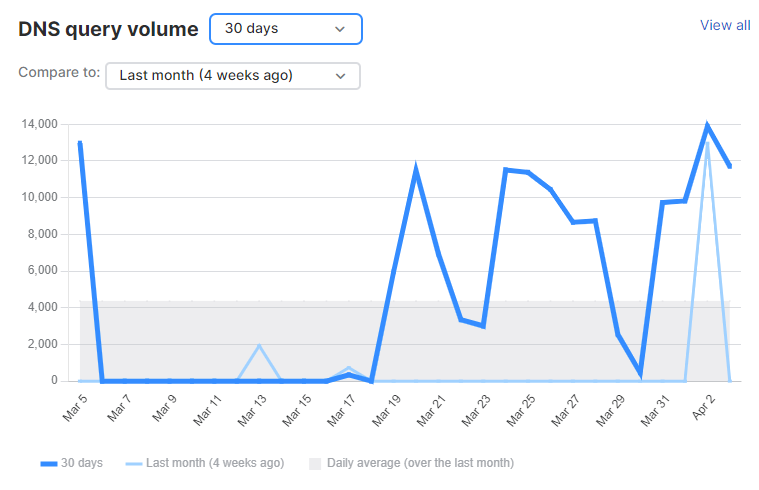
Click View all to see and generate more reports.
Top domain queries
This table shows the number of queries for domains with the most requests in the last seven days. It categorizes the domains as follows:
- Permitted domains: Shows the number of DNS requests served for permitted domains.
- Security blocks: Shows the number of DNS requests blocked for security reasons.
- Policy blocks: Shows the number of DNS requests blocked by your policies.
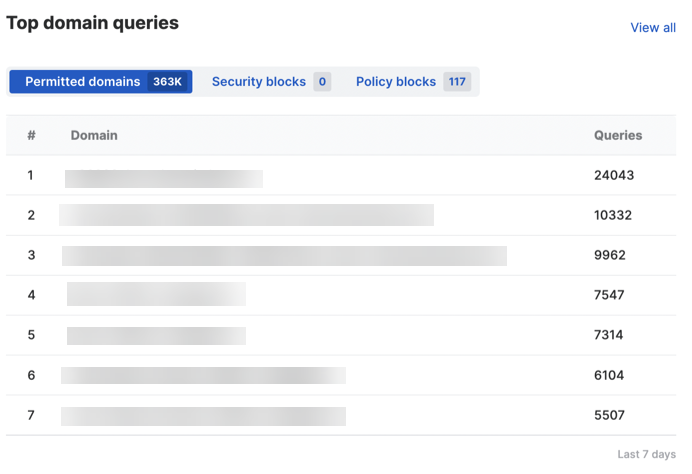
Click View all to see and generate more reports.
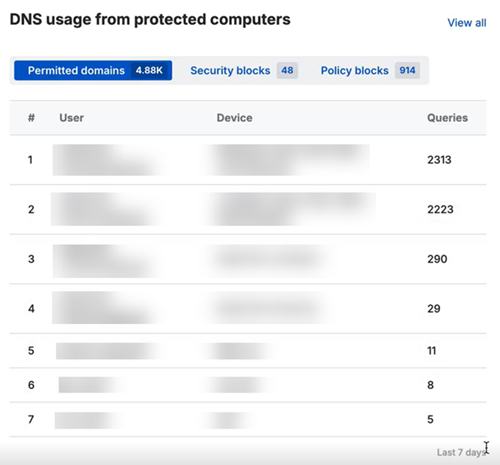
DNS usage from protected computers
You can see this report if you're using DNS Protection with Sophos Endpoint. It lists the top seven protected computers with the most DNS requests in the last seven days. For each computer, you can see the username, device name or ID, and number of DNS requests served or blocked. The report categorizes the DNS usage as follows:
- Permitted domains: Shows the number of DNS requests served for permitted domains. Click View all to see the report generated from the DNS usage by source template.
- Security blocks: Shows the number of DNS requests blocked for security reasons. Click View all to see the report generated from the High risk devices template.
-
Policy blocks: Shows the number of DNS requests blocked by your policies. Click View all to see the report generated from the DNS usage by source template.