Server Status
The Status tab in a server's details page lets you see the server's security health.
To see the status tab, do as follows:
-
Go to My Environment > Computers & Servers.
Alternatively, go to My Products > Server > Servers.
-
Click the name of the server you want to view details for.
- Click the Status tab.
The details you see depend on the server's operating system. See Windows servers or Linux and earlier Windows servers.
Windows servers
The Status tab shows the server's security health.
Some earlier versions of Windows Server might show different details. See Linux and earlier Windows servers.
Health status
Health status shows the Overall health of the server.
| Icon | Description |
|---|---|
| Good (Green check mark) | |
| Warning (Orange warning sign) | |
| Bad (Red warning sign) |
The overall health is based on the range of health assessments shown below it.
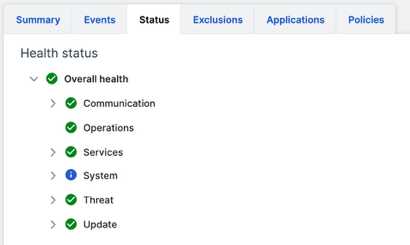
Health assessments
We assess the health of the following features:
- Communication: Communications between the server and Sophos Central, plus communications to remote sources of threat data.
- Operations: Operations such as uploads to Sophos Data Lake and file scanning.
- Services: Sophos drivers, processes, and services.
- System: The server's hardware specifications and the Sophos security products installed.
- Threat: The threat level and the status of device isolation and emergency protection.
- Update: Installation and updating status. The details also show if the server needs a post-update restart.
Each assessment shows a status: Good (Green), Warning (Orange), Bad (Red), or Info. The status of each assessment contributes to the overall health, unless the status is Info.
You can also see detailed assessments of the server's health in the Sophos Endpoint agent. Go to the server, double-click the Sophos icon in the taskbar, and click Endpoint Self Help.
Linux and earlier Windows servers
The Status tab in a server's details page lets you see the server's security health and details of any alerts.
It also lets you take action against alerts.
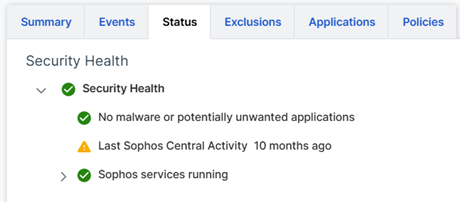
Security Health
Security Health shows the following information:
- Whether the device has detected malware or potentially unwanted applications.
- When the device last connected with Sophos Central. For example, for policies.
- Which Sophos services are running on the server.
The overall status (Red, Orange, or Green) is the same as that for the highest-priority item listed, excluding Last Sophos Central Activity.
Alerts
The page lists any alerts on the device. The details include:
- Alert details: For example, the name of the malware.
- When the alert occurred.
- The actions that you can take. These depend on the type of threat or event and are the same as the actions available in the Dashboard.
See Alerts.