Health check scores
Account Health Check shows scores for your account health. These reflect whether your devices or policies are using recommended, secure settings.
Go to My Environment > Account Health Check.
There are scores for overall health, for each security feature, and for each specific health check we do.
To filter the health check scores, see Filter the health check data.
Overall health
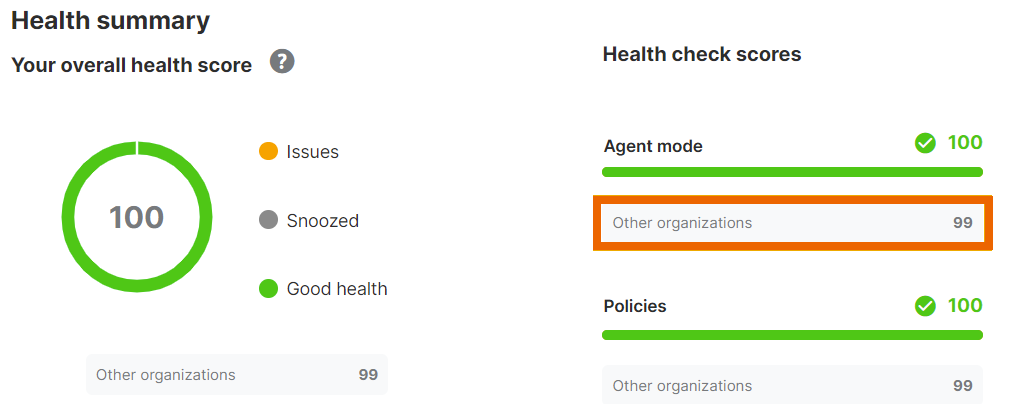
A Health Summary is shown at the top of the Account Health Check page.
Your Overall Health Score is a score out of 100. This score is the same as the lowest score out of all your health checks.
The doughnut chart reflects that lowest score.
Scores are broken down into Good health (green), Issues (yellow), and Snoozed issues (gray). Snoozed issues are issues that you've postponed dealing with.
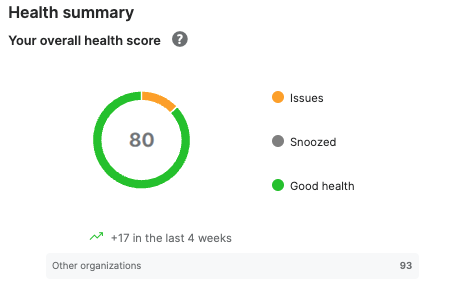
Under the chart, the Other organizations figure shows you the average score that other organizations achieve. See Scores compared to other organizations.
The trend arrow and number show how your overall score changed in the last four weeks. If you see a dash instead of a number, the score change is currently unavailable.
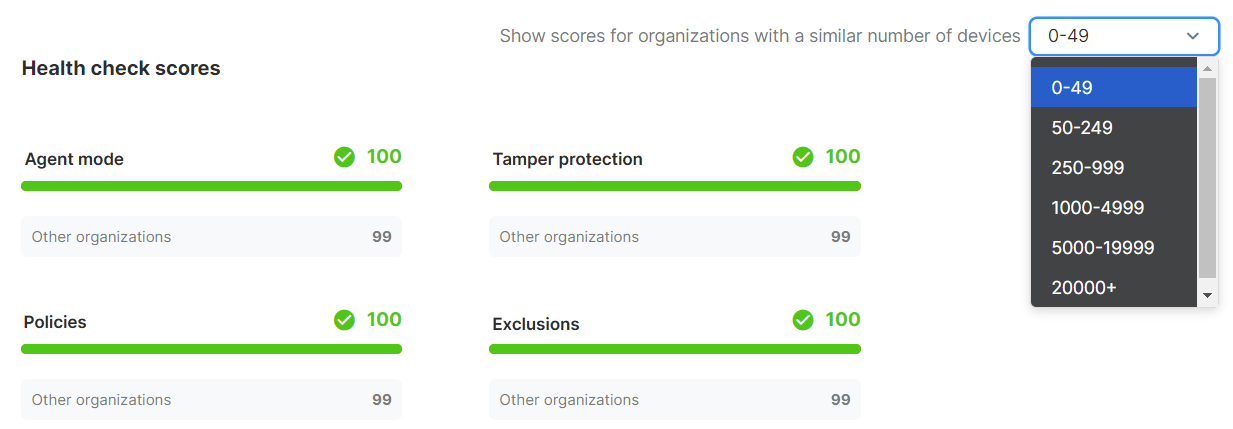
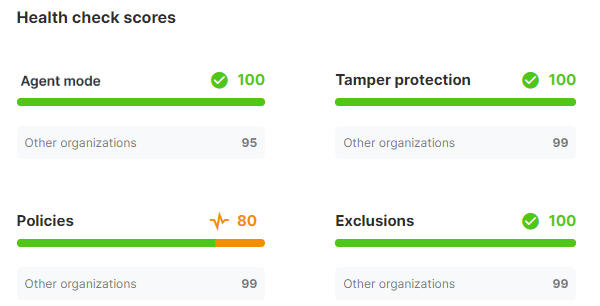
The Health check scores bar charts show your score out of 100 for each security feature and how it compares to other organizations. For details, see Scores for each security feature.
Scores for each check
In each health check, for example Endpoint agent mode, we show a score for that check.
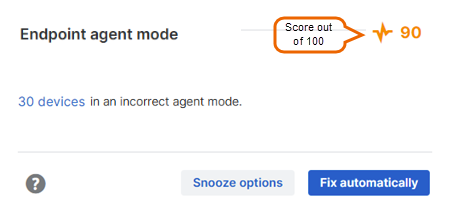
We calculate the score based on the number of devices or settings that comply with our recommendations.
Scores can range from 0 to 100. A score of 100 shows with a green checkmark. Any score less than 100 is shown in yellow and indicates that you can improve security.
Snoozed checks show a score in gray. Snoozing doesn't affect your scores.
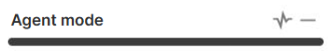
If we can't show a score, we show a dash in its place:
To get help to fix issues and improve your score, click the help icon in the bottom left of the check.
![]()
Scores for each security feature
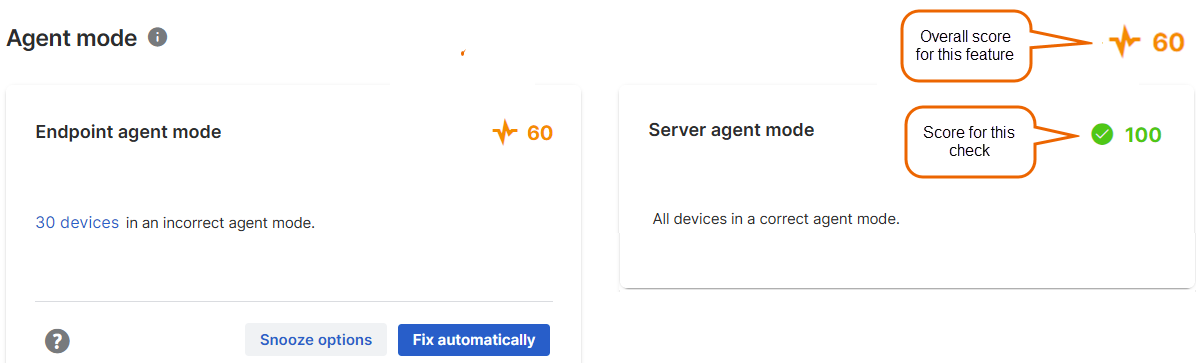
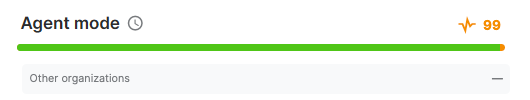
We show an overall score for each security feature, for example, Agent mode. You see this score in the upper right of that section on the page.
This score is the lowest score of the checks in that section.
How we calculate scores
Here's how we calculate the scores for each type of health check.
Agent mode
For Endpoint agent mode or Server agent mode, we calculate the percentage of devices that are in the correct agent mode. This means that the devices have all your licensed software.
For example, if you have 1000 devices and 900 are in the correct agent mode, you see a score of 90.
The overall score for Agent mode is the same as the lowest score of the two checks in this section.
Tamper protection
For Endpoint tamper protection or Server tamper protection, we calculate the percentage of devices that have tamper protection turned on.
If Global tamper protection is turned on, its score is 100. If it's turned off, its score is 0.
If global tamper protection is off, no devices have this protection. The endpoint and server checks show a score of 0. When you turn global tamper protection on, those checks show the percentage of devices with protection turned on locally.
The overall score for Tamper Protection is the same as the lowest score of the three checks in this section.
Policies
For Endpoint Threat Protection policy settings or Server Threat Protection policy settings, we calculate the score as follows:
In each policy, we deduct 10 from the score for each setting that doesn't match our recommended setting. So if a policy has two of these settings, we deduct 20, and the score is 80.
If you have multiple policies of the same type (for example, endpoint threat protection policy), we take the average score of those policies.
Some policy options don't have a recommended setting. We ignore those in our checks.
The overall score for Policies is the same as the lowest score of the two checks in this section.
Exclusions
For Endpoint policy exclusions or Server policy exclusions, we calculate the score as follows:
In each policy, we deduct 20 from the score for each insecure exclusion. So if a policy has two insecure exclusions, we deduct 40, and the score is 60.
If you have multiple policies of the same type (for example, endpoint exclusions), we take the average score of those policies.
For Global exclusions, we calculate the score as follows:
We deduct 20 from the score for each insecure exclusion. So if you have two insecure exclusions, we deduct 40, and the score is 60.
The overall score for Exclusions is the same as the lowest score of the three checks in this section.
Note
We only check for exclusions that are a significant security risk. Even if your exclusions health checks show a high score, regularly check that your exclusions are necessary and safe.
MDR authorized contact
If MDR authorized contact is specified, its score is 100. If it's not specified, its score is 0.
Data telemetry
For Protection improvement, we set the scores as follows:
If one recommended setting is turned off, the score is 60. If two settings are turned off, the score is 30. If all settings are turned off, the score is 0.
Firewall
For Automatic backups, firewalls must be licensed, managed by Central, and connected to Central to affect the health check score.
We calculate the score as follows:
- If the firewall backup frequency is set to Never, no firewalls are backed up automatically, and the health check score will be 0.
- If the firewall backup frequency is set to Daily, Weekly, or Monthly, and all licensed firewalls are added to the backup schedule, the health check score will be 100.
-
If you have firewalls that aren't added to the backup schedule, the health check score will be lower, depending on how many firewalls aren't backed up.
Example
You have three firewalls managed by Central, but only two firewalls are added to the backup schedule. The health check score will be 66.
For more information about firewall backups, see Firewall backup.
Scores compared to other organizations
You can see how your scores compare with other organizations.
By default, we show you average scores for organizations that are in the same size range and use the same Sophos Central data region. Look for Other organizations underneath each chart in the Health summary section.
If we can't show the Other organizations score, we show a dash in its place.
You can change the organization size we use for the Other organizations scores. You might want to do this if you have many devices you aren't using, or you just want to see how larger organizations score.
In Show scores for organizations with a similar number of devices, select the size range you want to see.