Report Generator
You can use a template and filters to generate a report.
You can select a report template, specify filters, generate a report, and save the template with your filter and display settings. You can also set up an export schedule for reports. You can download reports in the following formats: PDF, CSV and HTML. See Logs and Reports.
You can only save templates, schedule exports, and download reports if you have a Central Firewall Reporting Advanced license.
Generated reports that you can view in Sophos Central support up to 10,000 records in a report. Scheduled exports support up to 400,000 records in a report for CSV, and up to 10,000 records for HTML and PDF.
The report generator tab includes the following areas:
- Filters
- Chart
- Table
Filters
Go to My Products > Firewall Management > Report Generator to set up your filters.
Under Filters, you can select the firewalls, report template, and time frame. You can also specify queries.
Select your firewalls from the drop-down list and click Apply.If you want to deselect all of your firewalls, go to the drop-down list and click Deselect all then click Apply. You can also deselect them one at a time.
Note
You can only select multiple firewalls if they're all licensed.
Note
You can currently select up to 100 firewalls. For a higher number of firewalls you can run multiple reports with up to 100 firewalls in each one. Each administrator can configure a maximum of 100 scheduled reports. This means you can have up to 100 reports for all of the features that use this report format. For more information see Logs and Reports.
If you selected multiple firewalls, you can click on the text, for example, 3 Firewalls to see the names of those firewalls.
Under Report templates, you can select one of the following report templates:
- Antivirus: Malware or suspicious items that are blocked.
- Bandwidth usage: Bandwidth used by specific applications.
- Cloud app risks and usage: Cloud apps used and any risks associated with those apps.
- Firewall: Numbers of connections between specific IP addresses.
- IPS: Attempted attacks caught by IPS (Intrusion Prevention System).
-
Log viewer and search: Log entries generated by the firewall in non-aggregated form.
The Log viewer and search report doesn't include a chart, only a table.
-
SD-WAN: Summarizes how often SLAs are met per SD-WAN profile. It includes graphs to show SLA trends over time.
- SD-WAN SLA trend: Shows trends over time, per gateway, on jitter, latency, and packet loss.
-
SD-WAN Bandwidth usage: Summarizes bandwidth usage per gateway, including usage trends over time.
-
Security posture assessment: Shows key activity metrics for a customer's environment.
Under Components, you can select up to 10 components to include in the SPA report. Examples: Bandwidth usage, Web usage, Threat geo activity.
For more information, see Security Posture Assessment Report.
-
Synchronized app: Provides a summary of apps, app categories, and their activity volumes for applications identified by Synchronized app control.
- Threat geo activity: Blocked threats from certain countries.
- Threats and events blocked: All types of threats and events that are blocked.
- VPN usage: Amount of usage of specific VPN connections.
- Web usage: Visits to specific websites.
- Web user risk: Shows web activity summaries for users visiting high-risk websites that their web policies may not restrict.
- XX-Ops: Summarizes advanced threat activity detected or blocked by the firewall. Includes traffic from devices flagged by the MDR threat feed from an MDR investigation.
- Zero-day protection: Files and emails that contain suspicious attachments that are sent to Sandstorm.
Under Time frame, you can specify the time frame for which information is shown by selecting one option. If you select Custom, you can select the dates and times between which information is shown.
Note
If you don't have a firewall reporting license, you can't specify a time frame that starts more than seven days ago.
Add filters
To add filters, do as follows:
- Under Query, select or enter the name of the column on which you want to filter.
- Enter the values by which you want to filter the report.
-
To change the operator used for comparison, click the equal sign next to the column name, and select an option from the drop-down list.
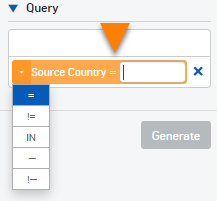
The table below shows a list of the operators:
Operator Rows shown =Rows in which the column value matches the value you want to filter
The value is case-sensitive.
Examples:
To show all rows in which the domain matches a specific domain, enter the following:
DOMAIN = www.bing.com
To show all rows in which the IP address matches a specific address, enter the following:
Source IP = 10.8.9.191
!=Rows in which the column value does not match the value you want to filter
The value is case-sensitive.
<Rows in which the column value is less than the value you want to filter (applies only to numeric values) <=Rows in which the column value is less than or equal to the value you want to filter (applies only to numeric values) >Rows in which the column value is greater than the value you want to filter (applies only to numeric values) >=Rows in which the column value is greater than or equal to the value you want to filter (applies only to numeric values) INRows in which the column value matches any value in a comma-separated list of values you want to filter
The values are case-sensitive.
Example:
To show all rows in which the destination IP address matches any value in a list of IP addresses, enter the following:
Destination IP IN 13.107.21.200,204.79.197.200
~Rows in which the column value matches a wildcard expression you want to filter. The wildcard is an asterisk: *
The expression isn't case-sensitive.
Examples:
To show all rows in which the URL contains a specific string, enter the following:
URL
~*amazon*To show all rows in which the source IP address matches any address in a subnet, enter the following:
Source IP ~ 13.225.78.*
!~Rows in which the column value does not match a wildcard expression you want to filter. The wildcard is an asterisk: *
The expression isn't case-sensitive.
-
Repeat this process if you want to add more filters. A row is only shown if it meets the conditions of all the filters.
- To remove a filter, click the delete button next to the filter:
 .
. -
Click Generate to show the selected report using the filters that you've specified.
If the time frame you've selected is longer than 30 days, it may take some time to get the data. If it takes more than a few seconds, you see a message.
-
To continue waiting to see the report, click OK.
The report is added to the queue. When it's ready, it's shown on the Report Generator tab automatically.
-
If you later decide to stop waiting, you can click Start Another Report.
You can view another report while you’re waiting. However, when the first report is ready, you must go to the Queue tab to view it.
-
To stop generating the report, click Cancel.
-
Charts
You can select the chart type in the top right of the area.
- Bar
- Horizontal bar
- Pie
- Line
- Stack-area
To select which information is shown on each axis, do as follows:
- Click the screwdriver and spanner button in the top right of the area:
 .
. - In the top box, select which information is shown on the x-axis.
- In the next box, click the arrow and select which information is shown on the y-axis.
- If a line or stack-area chart is shown, in the bottom box, click the arrow and select which information is shown on the z-axis.
When you select a different chart type, it shows default information on each axis, even if you previously changed it.
If you hover over the chart, the data values are shown.
Schedule reports
To set up an export schedule for reports, do as follows:
-
Click Schedule.
You can schedule up to 100 reports.
Note
You can also generate an export by clicking PDF, CSV, or HTML. You can download your exported reports from Scheduled Exports.
-
Enter a Template Name.
- Select the Time frame for the data you want to include.
- Configure Export frequency settings.
-
Select the Export format.
You can export the report in the following formats: PDF, CSV, or HTML.
Note
The report formats have the following restrictions:
-
PDF: A maximum of 10,000 rows and 15 columns.
-
HTML: A maximum of 10,000 rows and 23 columns.
-
CSV: A maximum of 100,000 rows and 23 columns.
-
-
Select the Export notification/delivery method.
We recommend that you send the link in an email if the report includes personally identifiable information.
The report is sent to your Sophos Central email address, as specified in Account Details.
You must enter your Sophos Central sign-in credentials to view reports from a link.
You can send the report to other Sophos Central administrators.
-
Click Save.
You can download your exported reports from Scheduled Exports.
Save a report template
Click Save Template to save the selected report template with any of the filters or display settings that you've applied, including the following:
- Query filters
- Chart type
- Chart axes
- Table sorting
- Table columns
This saves you from having to make all the selections again. The report template is saved to the Saved Templates tab. The data isn't saved with the template.
You also can turn export scheduling on and off for this report template.
Tables
When the table is first shown, it uses a default set of columns. You can select which columns to show by clicking the column selection button in the top right of the table area: ![]() .
.
The rows are combined to remove duplicate rows. For example, by default, the table shows the number of hits for a specific rule ID, source IP, destination IP, and country. This is represented by one row:
| FIREWALL RULE ID | SOURCE IP | DESTINATION IP | SOURCE COUNTRY | HITS |
|---|---|---|---|---|
| 0 | 1.1.1.1 | 255.255.255.255 | Australia | 3 |
However, if you add another column in which the data is different in each row, for example, the user, one row is shown for each hit, with each row having the same rule ID, source IP, destination IP, and country:
| FIREWALL RULE ID | USER | SOURCE IP | DESTINATION IP | SOURCE COUNTRY | HITS |
|---|---|---|---|---|---|
| 0 | John Smith | 1.1.1.1 | 255.255.255.255 | Australia | 1 |
| 0 | Paul Jones | 1.1.1.1 | 255.255.255.255 | Australia | 1 |
| 0 | George Harris | 1.1.1.1 | 255.255.255.255 | Australia | 1 |
The more columns you add the more granular the information that is shown.
If the date column is shown, duplicate rows are grouped on the date and time as follows:
| Time frame | Row grouping |
|---|---|
| Less than or equal to 1 hour | Rows in which the date and time are the same (to the nearest minute). |
| Greater than 1 hour but less than or equal to 48 hours | Rows in which the date and time are the same (to the nearest hour). |
| Greater than 48 hours | Rows in which the date and time are the same (to the nearest day). |
Some columns include values that are hyperlinks. If you click one of these, a filter on that value is added to the Query box. You can then use this to filter the report. For example, in the table above, if you click Australia, a filter is added: Source Country = Australia. You can repeat this for other values to make the filter more specific. For the Threats and events blocked report, such hyperlinks also link to one of the other reports.
For the Log viewer and search report, the buttons in the top right of the area allow you to switch between the tabular view, which shows a limited number of columns, and the raw view, which shows all columns.