MDR dashboard
The Managed Detection and Response (MDR) dashboard offers visibility into the work our teams are doing behind the scenes to deliver the MDR service and protect your organization. It also shows a summary of threats we've recently detected, investigated, and mitigated for you, and your current account health summary.
To see the MDR dashboard, sign in to Sophos Central and go to My Products > MDR.
Account health check summary
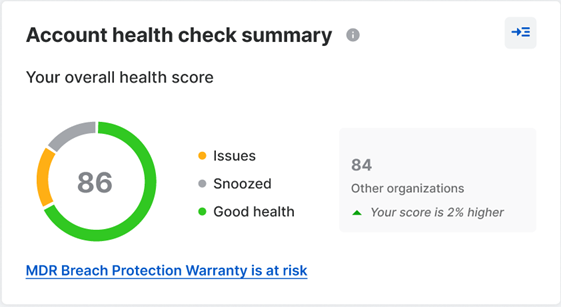
The account health check summary shows your current overall account health score out of 100.
If your score is less than 100, click View All or click the Account Health Check icon ![]() on the upper-right of the page to see your account health details and recommendations to improve your overall score.
on the upper-right of the page to see your account health details and recommendations to improve your overall score.
It also provides a comparison of your score with other organizations that have the same number of devices in your region.
If you have MDR Complete and your score is less than 100, a message about the MDR Breach Protection Warranty being at risk will also be displayed. See Breach Protection Warranty for MDR Complete.
MDR analyst coverage
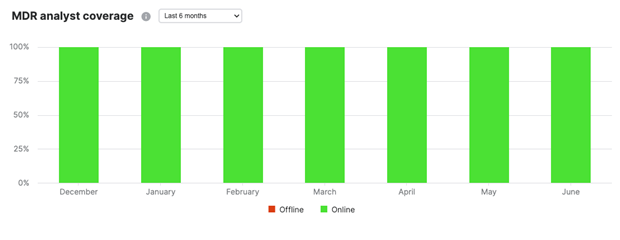
MDR is a 24/7/365 service. This chart shows the analysts' online status and availability in a 24-hour period, indicated with the green color.
To ensure that we always have someone available and actively looking after our MDR customers' incoming cases and detections, we check for a minimum of three active online analysts per eight-hour shift in a 24-hour period.
Threat hunt and intel effort
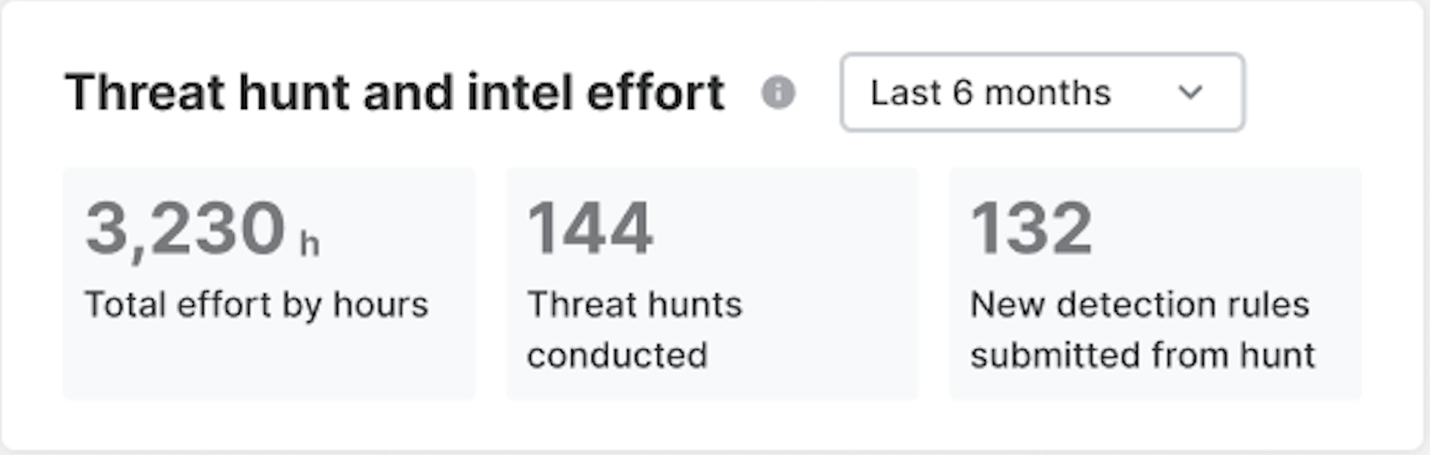
This widget provides three important metrics that demonstrate the value of the MDR service.
Total effort by hours
Total Effort by Hours is the combined effort of our Sophos threat hunting and intelligence teams. These hours are a measure of effort spent on proactively tracking established and emerging adversary groups, and studying their tools, techniques, and tactics to better protect and detect against them.
It is also a measure of the hours spent querying your data to search for threats within your environment with the objective of potentially finding a zero-day threat or simply finding improvements within our protection and detection capability. These combined hours represent the proactive effort going on behind the scenes, apart from detections and cases being generated. It's a critical part of the MDR service to protect you in the ever-changing threat landscape.
Threat hunts conducted
Threat Hunts Conducted is the total number of threat hunts performed by the team. Using your data, both Sophos and third-party vendor telemetry, our proactive threat hunts identify attacker behaviors that only a human can detect, and rapidly eliminate threats that evade detection by standard toolsets or other security products. Each threat hunt delves into the MITRE ATT&CK framework to thoroughly examine adversarial behaviors.
New detections from hunt
New Detections from Hunt are all the detection rules submitted based on Threat Hunt information to improve threat detection. Sophos reviews these submissions to create and update detection rules.
Threat hunt by MITRE ATT&CK®️ tactics
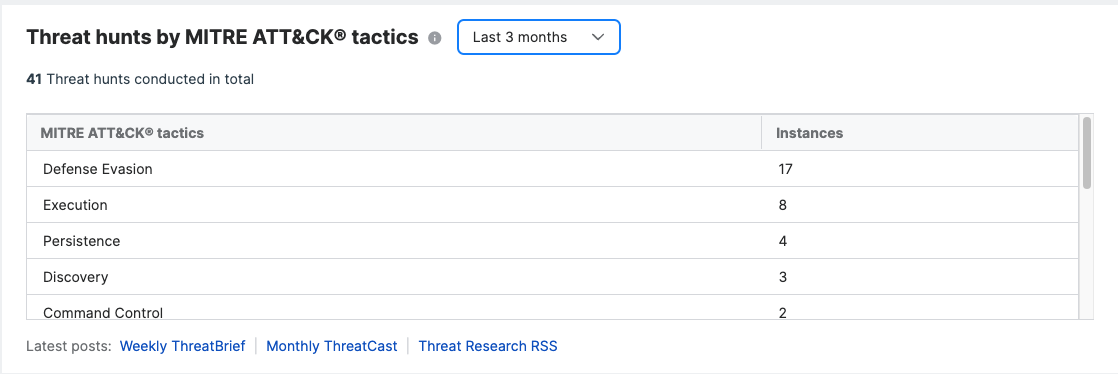
This provides the breakdown of the different MITRE ATT&CK® tactics found in Threat Hunts conducted. It's a great pair to the existing Threat hunt and intel effort widget. On this new widget, you'll see all the MITRE ATT&CK® tactics and how many were found in the threat hunts conducted by our MDR team. There are also links to the latest ThreatBrief and ThreatCast provided by the MDR team. You can copy the URL on the Threat Research's RSS feed and add it to your RSS feed app, so you always get the latest Threat Research news.
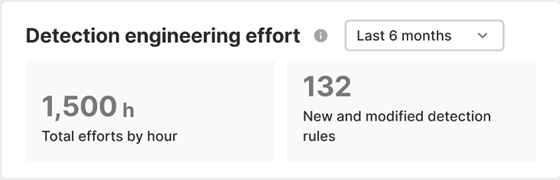
Detection engineering effort
Detection engineering effort is the combined and approximate effort in people hours of a small subset of our detection engineering team. This team, which is one of many, create and maintain security analytics to improve threat detection. All MDR customers see the same numbers because all benefit from this effort.
New and modified detection rules
New and modified detection rules is the total number for new and modified detection rules written by a subset of our detection engineering team. All of these rules are focused on third party integration threat detection use cases.
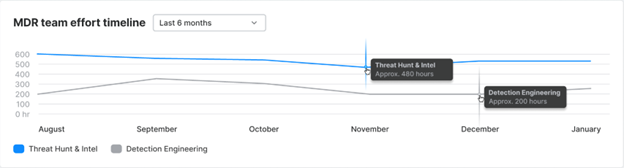
MDR team effort timeline
This is the combined effort by threat hunting and intelligence teams and detection engineering teams, shown in people hours (approximate) over time.
MDR case summary
The Analyst Effort shows the amount of time, measured in hours, the effort of our MDR analyst team as they conduct in-depth and methodical investigation on your detections and cases. This effort also includes the time spent on executing an extensive set of response actions on your behalf to remotely disrupt, contain, and fully eliminate the adversary identified from the case investigation.
The case break-down provides visibility on the number of cases that are "Escalated", which require advanced analysts' investigation and response actions. Escalated cases could also require collaboration from you to resolve. The metrics also show the count for your "Unescalated" cases, which our analysts fully investigated and resolved for you, without requiring any additional action or input from you.
We also added the number of cases created on the weekend. It's expected to be low due to low user activity over the weekend. However, attackers are still active on weekends, so our MDR analysts continue to monitor and respond to these cases 24/7.

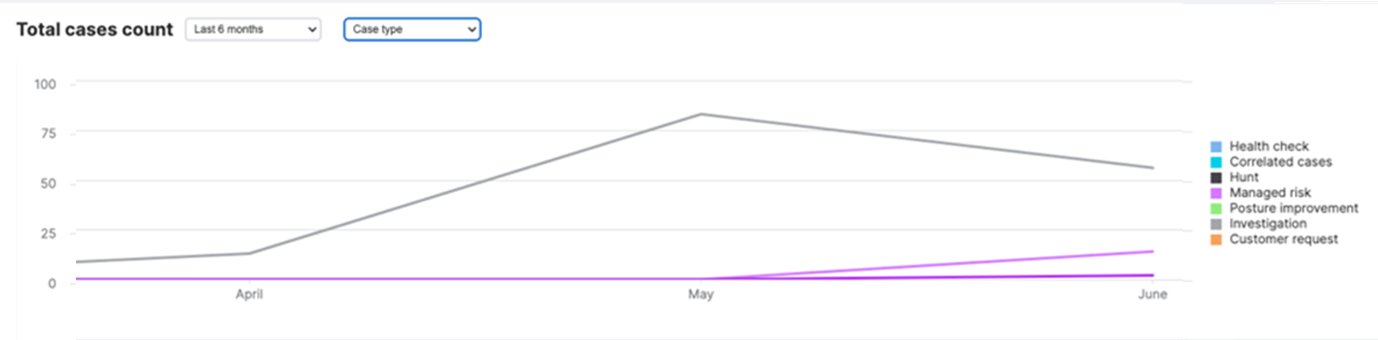
Total cases and total case count
These widgets provide our standard case metrics with different grouping options. This gives you a better visibility on the different kinds of cases generated for your environment and helps you understand how they are broken-down by severity, case type, status, verdict, and more.
Note
The case count on case status of "Action Required" isn't affected by the date range filter. This reflects any cases you currently have that are waiting for your reply.


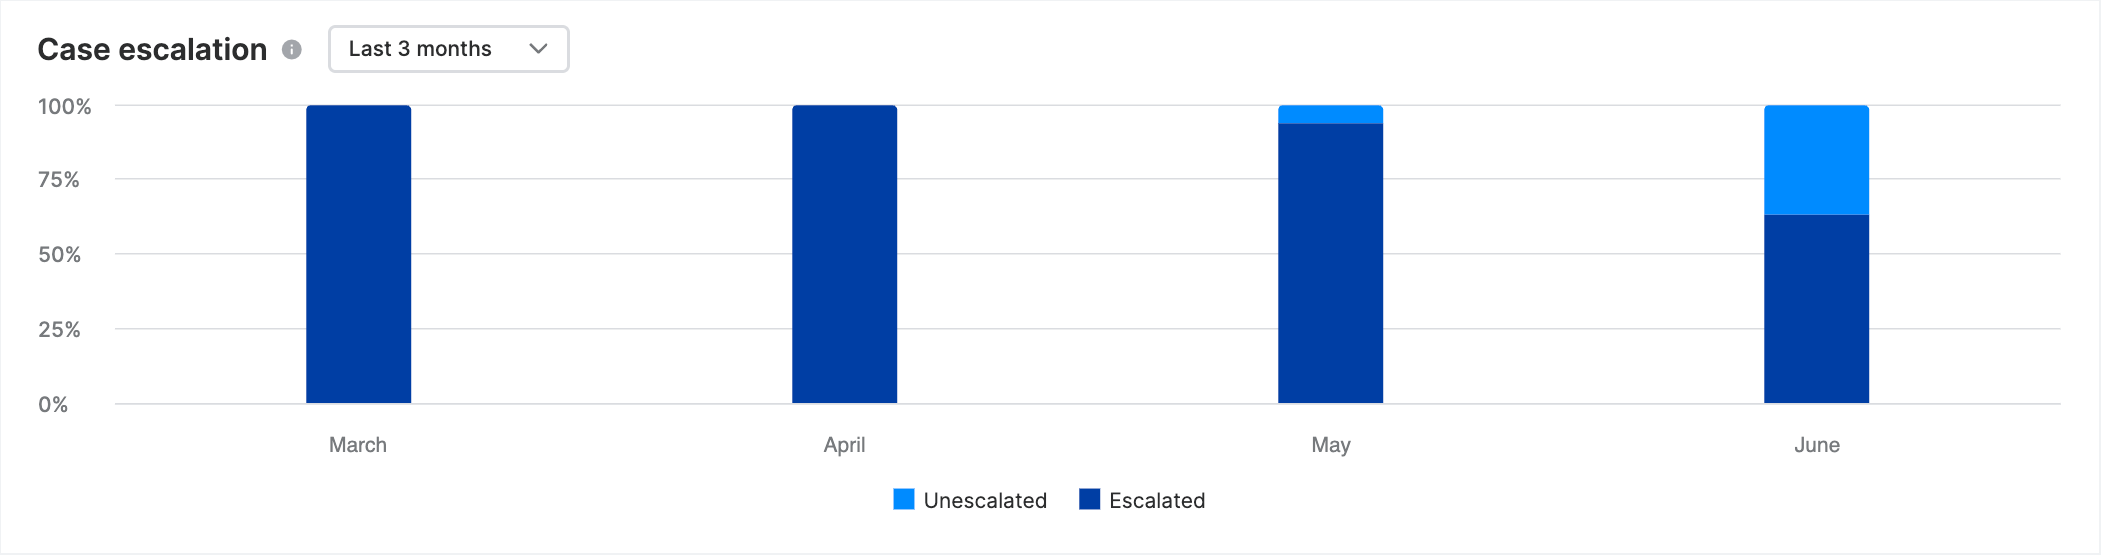
Case escalation
The volume of your escalated and unescalated Sophos Managed cases. This shows how likely your Sophos Managed cases are to be malicious.
Event pipeline
Event Pipeline shows in graphic form the life cycle of the data that we receive and generate detections from.
We use continually-updated detection rules to reduce the noise and focus on the detections that matter most, those with indicators of suspicious behavior. These detections automatically generate cases that our MDR Ops team investigate and escalate if needed.
You can see the noise reduction as a percentage next to the total number of detections.
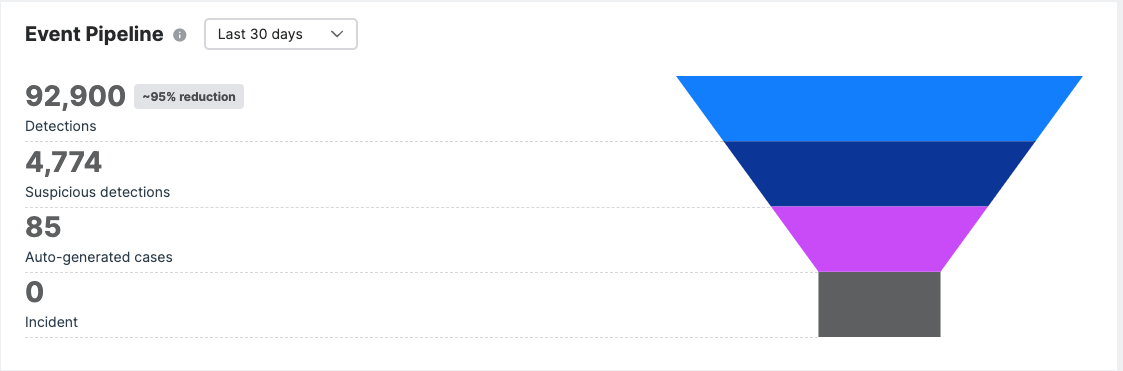
Hover over each layer to see a breakdown of detection sources, suspicious detection types, and the type of cases that were auto-generated.
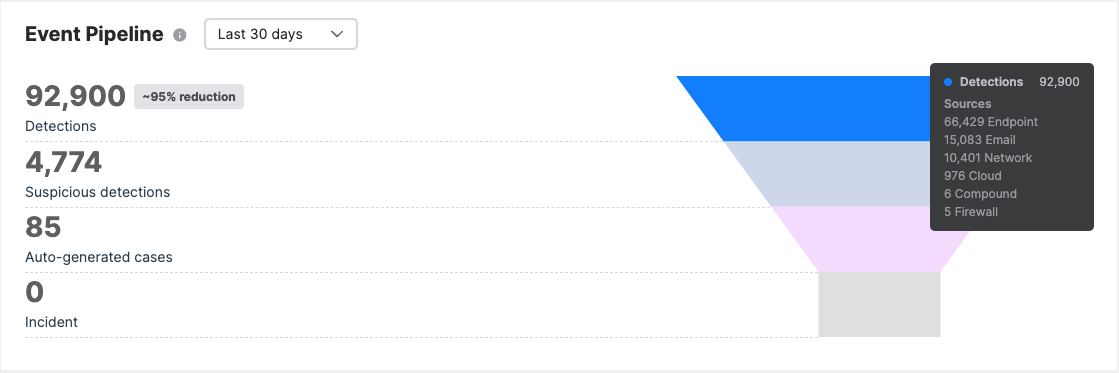
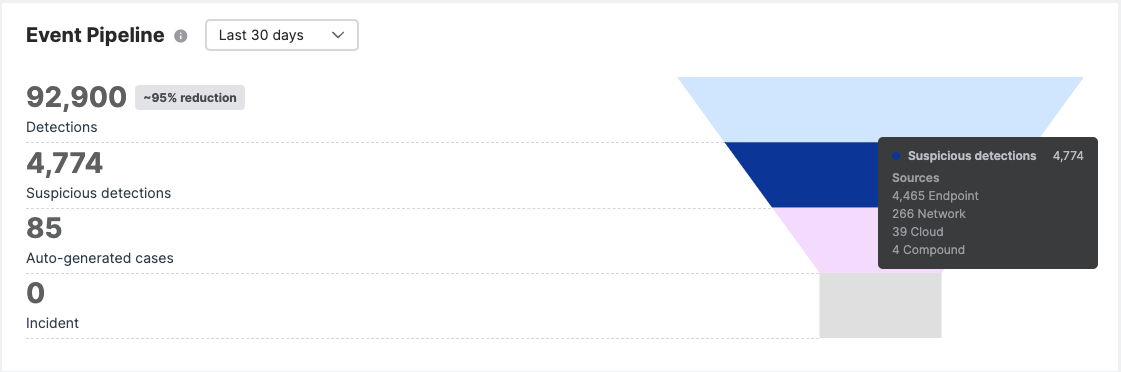
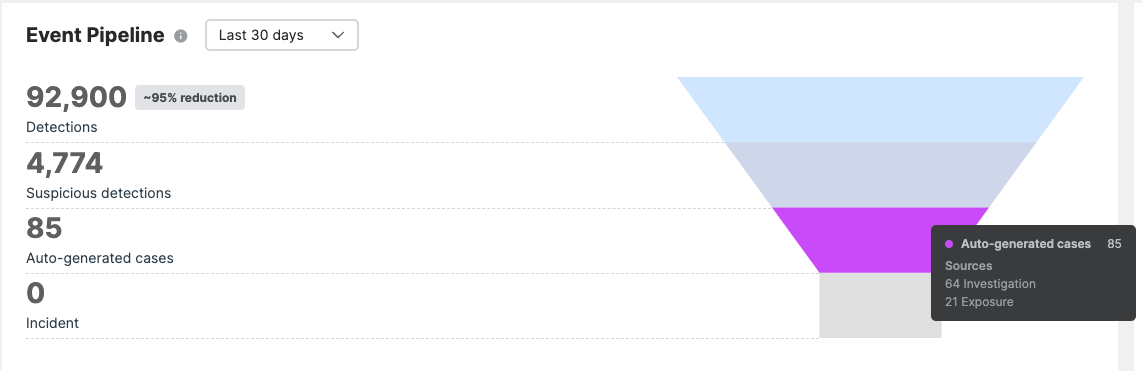
You can also click each layer to view the list of detections and cases.
- The Detections page lists detections from up to 30 days ago.
- The Cases page lists both your auto-generated cases and cases that you manually created.
- Both pages have filters that you can use to further manage your list.
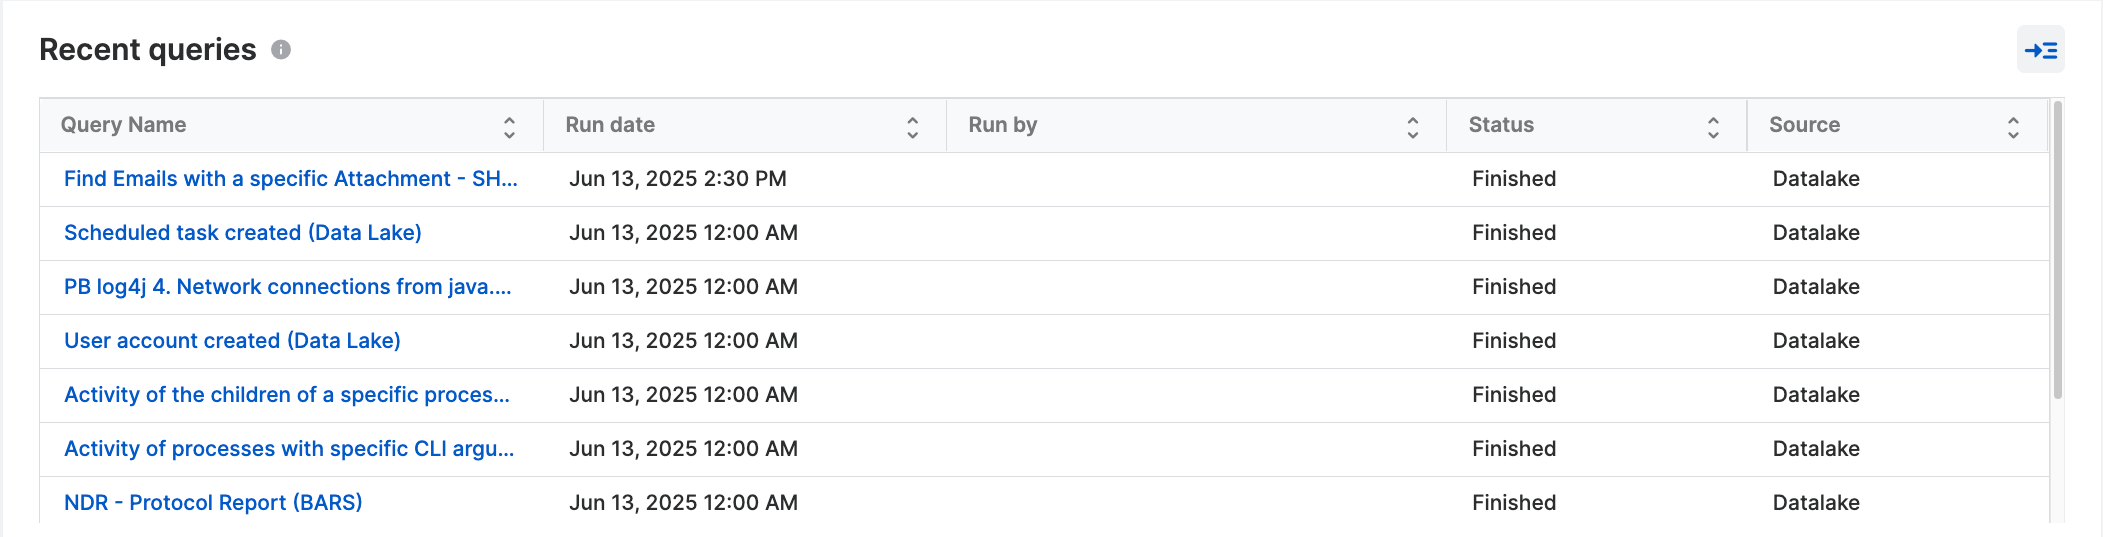
Recent queries
This shows recent queries run on your data for investigation and threat hunting. The list covers the last 24 hours of Data Lake queries and the last 2 hours of Endpoint queries run in Live Discover.
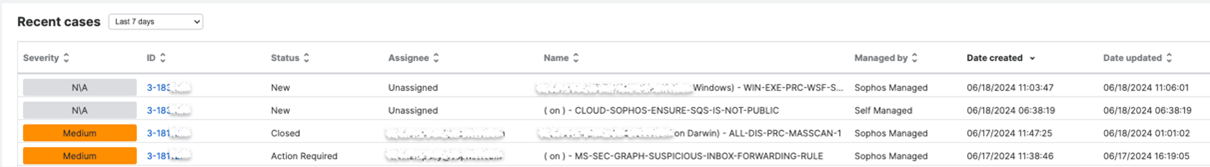
Recent cases
This shows a list of recently generated cases for your environment. It provides visibility on recent case activities that the MDR team has investigated and mitigated for you. It will also list any recent cases you've created manually.
Help with dashboard widgets
We've also added tooltip information to help you get familiar with all the dashboard widgets and their content. Hover your mouse over the information icon to view it.
All the widgets in the new MDR Dashboard are also available in the Sophos widgets gallery to use for creating your custom dashboards. See Create or edit a dashboard.