Dashboard
Overview
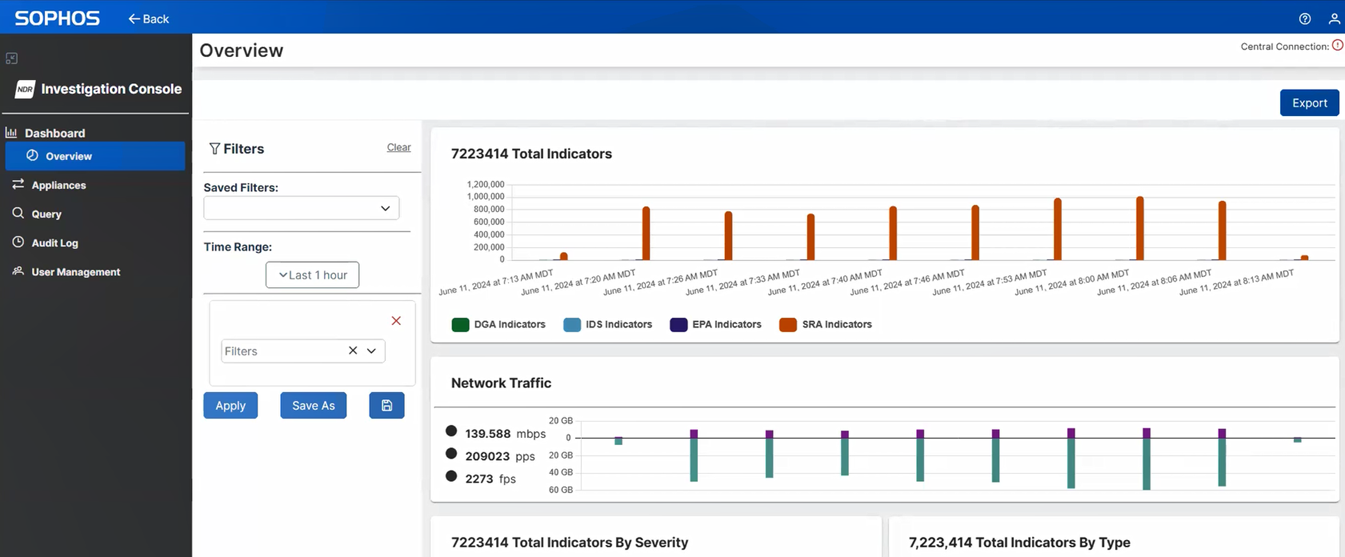
When you sign in to the investigation console, you're directed to the Dashboard - Overview page. This page shows the total indicators of compromise, your network traffic, a geolocation map, and recent flow detections.
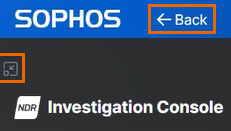
Click Back at the top left of the page to go back to Sophos Central. Click the Show/Hide icon to collapse and expand the menu on the left.
Click the question mark icon at the top right of the page to open the help page.
Click your Profile icon ![]() to do as follows:
to do as follows:
- See your account type and username.
- Sign out of the investigation console.
- Click This Appliance to see the system details. See System Details.
Filters shows on the left-hand side. You can configure the filters as follows:
- Saved Filters: Select a saved filter from the drop-down list.
-
Time Range: Click Time Range to select a time range to filter by from the drop-down list. The default is "Last 1 hour". You can select Absolute time range to specify a start and end date and time, or select a quick range, such as Last 7 days. You can also search the quick ranges. Click Apply time range.
Note
Data is only available for the last 30 days. If you select a longer time range, you won't see extra data.
-
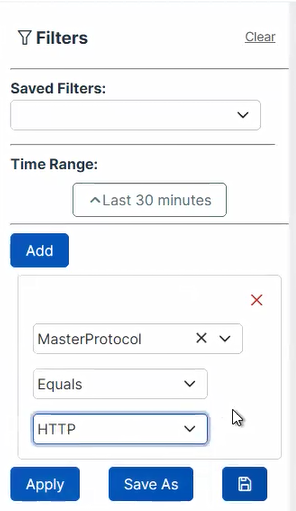
Filters: Select a database column from the drop-down list. When you select a database column, you see more options.
Select a database column, an operator, and a value. Example: Select MasterProtocol, Equals, and HTTP.
You see different options depending on which database column you select. If you select a database column where the output will be a number, you can select from a list of operators, such as "=", "<", and ">=".
Click Add to include more data. When you're finished configuring your filter, click Save As. If you're editing an existing filter, click the Save icon
 to override the existing settings.
You can clear the filter settings by clicking Clear.
When you click Apply, the charts and table reflect the settings specified in your filters.
Total Indicators
The bar chart shows the total indicators of compromise (IoC).
The indicator types are as follows:
- DGA: Domain Generation Algorithm
- IDS: Intrusion Detection System
- EPA: Encrypted Payload Analytics
- SRA: Session Risk Analytics
You can click indicator types to remove or add them to the bar chart.
You can hover over the bars to see the information for a specific date and time.
Network Traffic
The bar chart shows the following details about your network traffic:
- Network speed (data transfer rate) in megabits per second.
- The number of packets transferred per second.
- Flows (connections) per second.
You can hover over the bars to see how much data was transferred in a specific time period. This is measured in gigabytes sent and gigabytes received.
Total Indicators By Severity
The bar chart shows the severity categories for your IoCs and the number of IoCs in the categories.
The categories are as follows:
- Critical
- High
- Medium
- Low
- Info
You can hover over the bars to see the category and the number of IoCs in that category.
Total Indicators By Type
The donut chart shows the total number of IoCs by type, which is the same information as shown in the Total Indicators bar chart.
Hover over the donut segments to see the percentage represented by each IoC type.
Geolocation Map
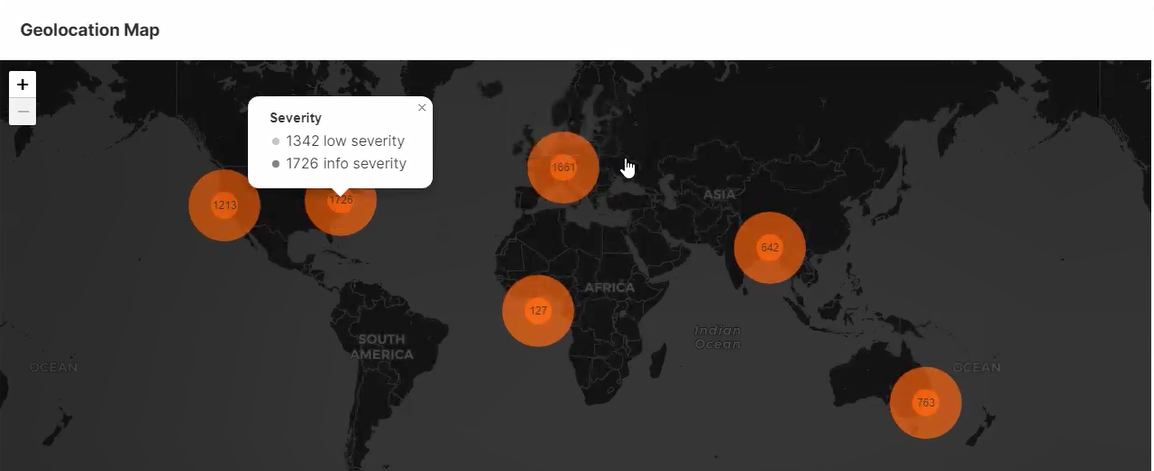
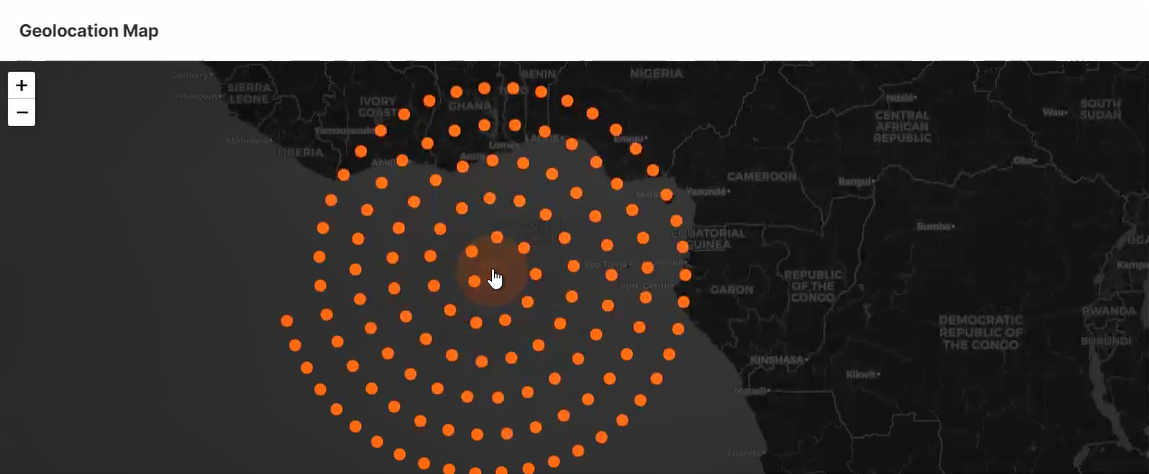
The geolocation map shows the regions from which the IoCs originate. The data is based on IP groupings. You can hover over the colored circles to see how many IoCs were detected in a specific region and which categories they belong to.
You can zoom in and out of the map using the Plus and Minus buttons. You can also click and hold your mouse button on the map, then move your mouse to move around the map.
If you click a colored circle when you're zoomed in, you see smaller circles that you can hover over.
Recent flow detections
The table shows details about your recent network flow detections. The rows show malicious activities for different network flows. An example of a network flow is a file download.
Many details are shown for a network flow. For information about Sophos-specific tables and fields for live data on devices, see Sophos schema.
