Query
We provide a range of queries for you to use to check your devices. You can edit these queries. You can also create queries. You'll need to be familiar with ClickHouse SQL. See ClickHouse: SELECT Query.
Library
In the Library tab, you can create, run, and save queries.
To create a new query category, click the Plus icon ![]() at the top right of the query library, type a name and description for the category, and click Create.
at the top right of the query library, type a name and description for the category, and click Create.
To create a new query, type it into the box on the right of the screen. You can then click Run to test it. The query results are shown underneath the query. To save the query, click Save As, select a category, type a name for the query, and click Create.
Saved categories and queries are shown in the Library tab. We provide a range of pre-configured queries for you.
You can open and run existing queries. To do this, click the category to expand it, then click the query.
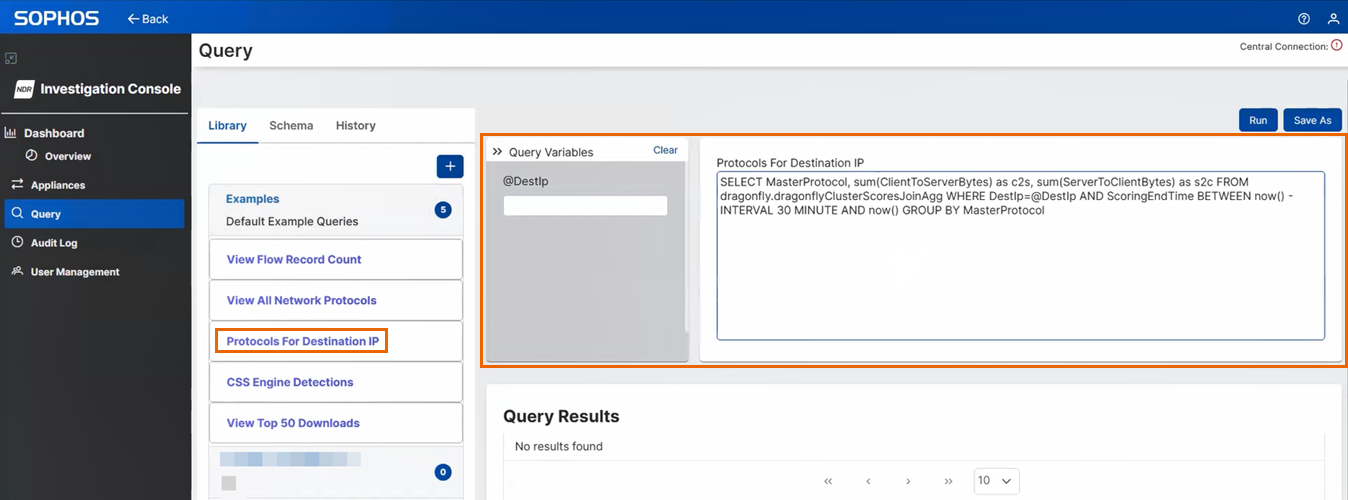
Here's the "Protocols For Destination IP" query.
If the query contains a variable, such as @DestIp, it'll show to the left of the query. You can then type the value in the box underneath the variable, for example, 172.32.0.1. When you save the query, the variable's value will automatically be shown the next time you select the query. So, instead of seeing @DestIp in the query text, you'll see 192.0.2.0.
Schema
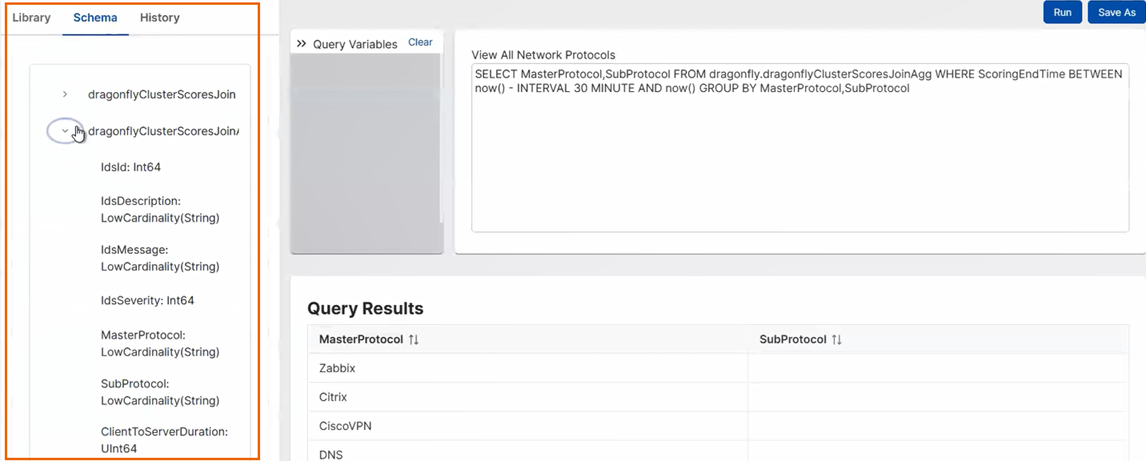
When you run a query, the schema for each table that you can query is shown on the Schema tab. Expand the schema name to see the fields, and the field types.
Here's an example.
History
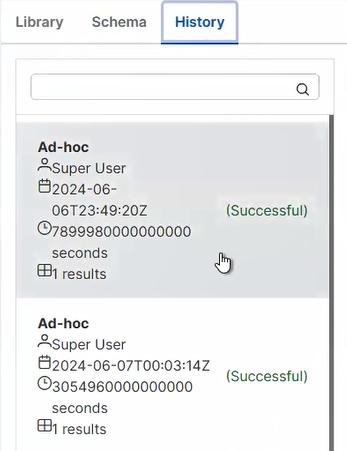
In the History tab, you can see the following information about the queries that have been run:
- Type of user. Example: Super User
- Date and time.
- The number of results.
- Whether the query was successful or failed.
Here's an example.


