System Details
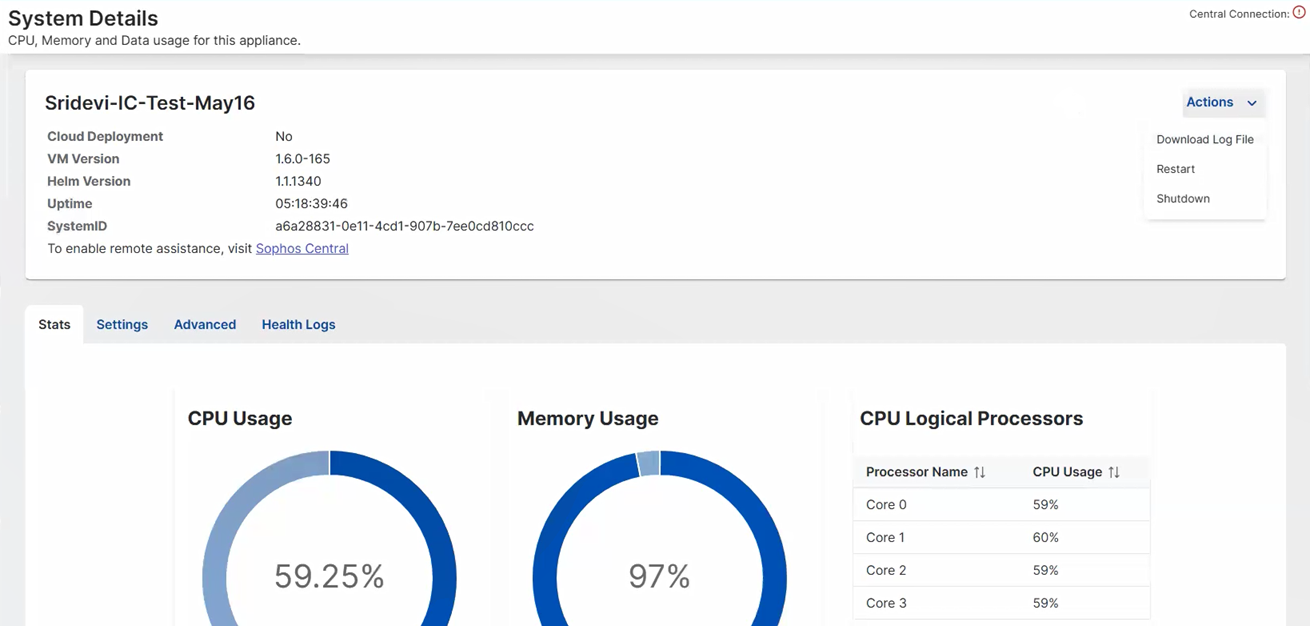
The System Details page shows the investigation console's details, such as its name and uptime. It also shows the console's CPU, memory, and data usage.
To turn on remote assistance, click the Sophos Central link. This takes you to Sophos Central. Click your Profile icon ![]() , and then click Support settings. See Account Details: Sophos Support..
, and then click Support settings. See Account Details: Sophos Support..
Under Actions, you can do as follows:
- Download Log File: Download the log file as a .zip file. This is similar to the log bundle you download from the integrations appliance.
- Restart: Restart the investigation console.
- Shutdown: Shut down the investigation console.
Stats
The Stats tab shows the following statistics for the investigation console:
- CPU Usage: Shows overall CPU usage across all CPU processors.
- Memory Usage
- HDD Root Usage
- HDD Data Usage
- CPU Logical Processors: Shows CPU usage for individual processors.
Settings
On the Settings tab, you can update the management interface settings.
-
To add or edit your IPv4 Configuration, click Edit. You can select DHCP or Static. If you select Static, you must enter the following information:
- IPv4/Netmask: Type in your IP address and select your subnet mask. Example:
192.0.2.10and/24 (255.255.255.0). - Gateway IP: Type in your gateway IP address. Example:
192.0.2.1. - DNS: Type in the address of a DNS server. Example
8.8.8.8. -
DNS 2: Optionally, type in a secondary DNS address. Example:
8.8.4.4.Note
The DNS server addresses can be private or public.
Click Save.
- IPv4/Netmask: Type in your IP address and select your subnet mask. Example:
-
To add or edit your Web Proxy settings, click Edit, then click Enable Web Proxy. You can configure the following settings:
-
Web Proxy Type: Select Anonymous or Authenticated.
Note
If you select Authenticated, you must enter a Username and Password.
-
Hostname: Enter the hostname of your web proxy. Example:
proxy.your-domain.com. - Port: Enter the port on which you access your web proxy.
-
Advanced
The Advanced tab shows the Kubernetes pod details. The containers run inside the pods. Most of the pods have one container, but there are a few that have two.
The Advanced tab shows the following details:
- Name: The name of the pod.
- Ready: How many containers are running in the pod, and the total number of containers. Example: 1/2.
- Status: The status of the pods. The possible statuses are as follows: "Pending", "Running", "Succeeded", "Failed", and "Unknown".
- Restarts: How many times the pod has restarted, and how long ago the last restart was. Example: 3(5d18h41m ago).
- Age: How long ago the pod was created.
Click the Refresh icon ![]() on the upper right to update the statuses.
on the upper right to update the statuses.
Health Logs
The Health Logs tab shows logs for the processes that handle the connection between the investigation console and the integration appliances. You can see the following details:
- Level: The severity level of the event.
- Module: The module in which the event occurred.
- Message: The log message describing the event.
- Date/Time: The date and time of the event.
Click Filter to filter your logs by keyword, start date, and end date.
