Switch management
The Switch management page shows all settings configured by Sophos Central administrators for a switch.
Note
You can only see settings configured locally on the switch that have been synchronized with or replicated in Sophos Central.
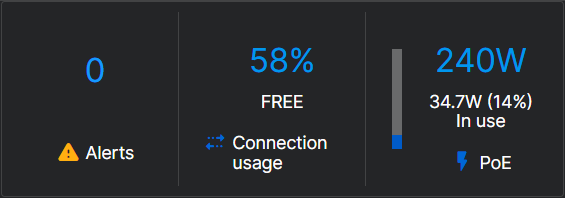
You can see the following details about the switch:
- Alerts: Shows the number of alerts the switch has reported to Sophos Central. Click the number to go to the Alerts page. See Alerts.
- Connection usage: Shows the current connection usage as a percentage of the available capacity.
- PoE: Shows the total power available and the amount of power the switch is delivering to connected PoE devices.
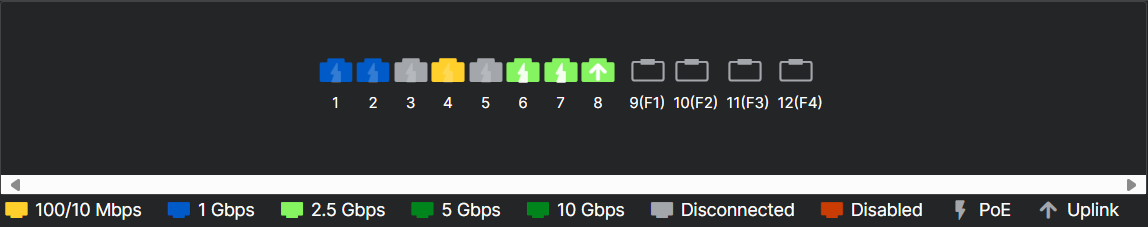
You can also see an overview of the switch ports. Hover over a port to see the port settings.
System details
The System details tab shows information about your switch. You can also reapply the switch settings, restart your switch, and remove it from Sophos Central management.
You can see the tags you've applied to your switch and its location. You can also see when the last event from the switch was received by Sophos Central. Hover over the the last event to see the date and time of the latest communication events between the switch and Sophos Central.
Basic details
The Basic details tab shows information about your switch.
You can see the following details:
- Serial no.: The serial number of the switch.
- Model: The switch model.
- System name: The device name. The default name is the same as the switch model. Click edit
 to change the name of your switch, its location, and contact information.
 -
State: The status of the switch.
- Waiting for sync: Changes in Sophos Central are waiting for synchronization.
- Pending: Sophos Central has tasks waiting to be sent to the switch.
- Syncing: The switch settings are synchronizing.
- Out of sync: An error requires attention.
- Suspended: The switch firmware is out of date and needs to be updated.
- Manual synchronization needed: Sophos Central was unable to synchronize settings to the switch. To synchronize, click Reapply all settings.
-
Parent: The site or stack from which the switch has received its configuration template.
- MAC Address: The MAC address of the switch.
- Powered on: The amount of time since the switch was last powered on.
To restart your switch, click Reboot.
Tip
Select Continuous PoE power in the Reboot dialog to keep connected PoE devices powered on when you restart your switch.
To reset the admin password, click Recover password and enter a new password that meets the following requirements:
- Minimum 10 characters
- Maximum 32 characters
- At least one uppercase letter, lowercase letter, and number
- One of the following special characters:
@,~,%,*,#,+,-,=
Confirm the password and click Recover password to reset it.
Note
If your switch isn't registered in Sophos Central, you can register it using the serial number, then use Recover password to change the password. See Add switches.
If your switch can't communicate with Sophos Central, you must reset it to factory settings using the reset button located on the device and use the default password printed on a sticker in the packaging. See Operating Instructions.
To stop managing your switch from Sophos Central, click Remove from Sophos Central.
Firmware
Firmware shows the Switch firmware and Sophos Central agents versions. You can apply the new agent firmware when it becomes available.
Turn on Update Sophos Central agents automatically to update your switch automatically when new firmware is available.
If your firmware updates fail, do as follows:
- Allow access to
jfrog-prod-use1-shared-virginia-main.s3.amazonaws.comfrom your network. If the switch can't reach this domain, the firmware update fails. See Domain requirements. - Check the time settings on your switch. If it isn't set correctly, the firmware update can fail. See System time.
- Check the Sophos Central alert for the upgrade failure. It contains information on the error. See Alerts.
System time
On the System time tab, you can configure Simple Network Time Protocol (SNTP) settings for your switches. SNTP ensures accurate device clock time by synchronizing the switch's time with a network SNTP server.
You can configure the following settings:
- SNTP status: Select On or Off to turn SNTP on or off. Select Not set to use the local switch configuration.
-
Primary NTP server address: Enter an NTP server's IP address or hostname, or use the default server
0.sophos.pool.ntp.org.Note
Sophos provides four pools of NTP servers at
[0-3].sophos.pool.ntp.org, for example,1.sophos.pool.ntp.org. -
Primary NTP server port: Enter the port to use for NTP from
1to65535. The default port is123. - Secondary NTP server address: Enter the IP address or hostname of an NTP server.
- Secondary NTP server port: Enter the port to use for NTP from
1to65535. The default port is123. -
Timezone: Select one of the following options:
- Not set: Use the local switch time zone settings.
- Set by time: Select the GMT difference from the drop-down list. For example, select
-5:00for GMT -5. -
Set by country: Select a location from the drop-down list.
Note
Not all country selections are available locally on Sophos Switch. If you select a country option that isn't available locally on the switch, Sophos Central automatically changes to Set by time and adjusts to the equivalent GMT offset to synchronize the configuration with Sophos Switch.
-
Daylight saving time: Select one of the following options:
- Not set: Use the local switch daylight saving time settings.
- Recurring: Set the schedule for daylight saving time manually.
- Off: Don't adjust for daylight saving time.
-
Recurrence start: Set the week, day, month, hour, and minute at which daylight saving time starts.
- Recurrence end: Set the week, day, month, hour, and minute at which daylight saving time ends.
Configuration source: Shows the origin of the SNTP settings.
System statistics
The Statistics tab shows information about traffic sent and received by the ports and protocols on the switch.
L2
L2 shows information about Layer 2 protocols. Select Spanning tree, GVRP, or CDP from the drop-down list to see statistics for those protocols.
Spanning tree
STP prevents network loops by exchanging Bridge Protocol Data Units (BPDUs) with other switches on the network. When you select Spanning tree, you can see the following information:
- Port: The port to which the traffic statistics apply
- RX BPDU: The number of BPDUs received
- TX BPDU: The number of BPDUs sent
- Invalid BPDU: The number of BPDUs the switch considers invalid
GVRP
GARP VLAN Registration Protocol (GVRP) uses "Join" and "Leave" messages to manage the switch's VLAN membership. When you select GVRP, you can see the following information:
- Port: The port to which the traffic statistics apply
- RX join empty: The number of "JoinEmpty" messages received
- RX join in: The number of "JoinIn" messages received
- RX leave in: The number of "LeaveIn" messages received
- RX leave all: The number of "LeaveAll" messages received
- RX leave empty: The number of "LeaveEmpty" messages received
- RX empty: The number of "Empty" messages received
- RX total: The total number of GVRP messages received
- Drop: The number of GVRP messages dropped
- TX join empty: The number of "JoinEmpty" messages sent
- TX join in: The number of "JoinIn" messages sent
- TX leave in: The number of "LeaveIn" messages sent
- TX leave all: The number of "LeaveAll" messages sent
- TX leave empty: The number of "LeaveEmpty" messages sent
- TX empty: The number of "Empty" messages sent
- TX total: The total number of GVRP messages sent
CDP
Cisco Discovery Protocol (CDP) is a proprietary protocol for discovering and managing neighboring network devices. When you select CDP, you can see the following information:
- Port: The port to which the traffic statistics apply
- RX v1: The number of CDP version 1 messages received
- RX v2: The number of CDP version 2 messages received
- RX total: The total number of CDP messages received
- TX v1: The number of CDP version 1 messages sent
- TX v2: The number of CDP version 2 messages sent
- TX total: The total number of CDP messages sent
- Invalid checksum: The number of CDP messages with an invalid checksum
- Other errors: The number of CDP messages with other errors
L3
L3 shows statistics on Layer 3 protocols, such as DHCP snooping.
DHCP snooping
DHCP snooping lets you protect your network from unauthorized DHCP servers by specifying which ports on the switch connect to your DHCP servers. The DHCP snooping table shows statistics about DHCP traffic on the switch. You can see the following information:
- VLAN: The VLAN to which the traffic statistics apply
- RX discovers: The number of "DHCPDISCOVER" messages received
- RX requests: The number of "DHCPREQUEST" messages received
- RX releases: The number of "DHCPRELEASE" messages received
- RX declines: The number of "DHCPDECLINE" messages received
- RX informs: The number of "DHCPINFORM" messages received
- TX offers: The number of "DHCPOFFER" messages sent
- TX acks: The number of "DHCPACK" messages sent
- TX naks: The number of "DHCPNAK" messages sent
- MAC discard: The number of DHCP messages discarded due to a MAC address mismatch
- Server discard: The number of DHCP messages discarded from servers on untrusted ports
- Option discard: The number of DHCP messages discarded due to option violations
- Total discard: The total number of DHCP messages discarded
802.1X security
802.1X security protects your network by requiring devices to authenticate before being granted network access. The 802.1x security table shows statistics about 802.1x authentication traffic on the switch. You can see the following information:
- Port: The port to which the traffic statistics apply
- TX req ID: The total number of EAP-Request/Identity frames sent
- TX req: The total number of EAP-Request frames sent, excluding the EAP-Request/Identity frames
- TX total: The total number of authentication messages sent
- RX start: The number of start messages received
- RX logoff: The number of logoff messages received
- RX resp ID: The total number of EAP-Request/Identity frames received
- RX resp: The total number of EAP-Request frames received, excluding the EAP-Request/Identity frames
- RX invalid: The number of invalid messages received
- RX length err: The number of messages received with length errors
- RX total: The total number of 802.1x messages received
- RX version: The number of version messages received
- Last RX src MAC: The source MAC address of the last received authentication message
Port
The Port table shows statistics about all traffic on all ports of the switch. You can see the following information:
- Port: The port to which the traffic statistics apply
- RX bytes: The total bytes received on the port
- RX n unicast: The total bytes of unicast packets received on the port
- RX discard: The total bytes of discarded packets on the port
- RX multicast: The total bytes of multicast packets received on the port
- RX broadcast: The total bytes of broadcast packets received on the port
- RX error: The number of packets received with errors
- HC in count: The High Capacity (HC) IN COUNT, or total bytes received on the port
- TX bytes: The total bytes sent on the port
- TX unicast: The total bytes of unicast packets sent on the port
- TX n unicast: The total bytes of unicast packets sent on the port
- TX discard: The total bytes of sent packets discarded on the port
- TX multicast: The total bytes of multicast packets sent on the port
- TX broadcast: The total bytes of broadcast packets sent on the port
- TX error: The total bytes of error packets sent on the port
- HC out count: The High Capacity (HC) OUT COUNT, or total bytes sent on the port
RMON
The RMON table shows statistics about RMON traffic on the switch. You can see the following information:
- ID: The configured index for RMON events
- Data source: The configured data source for RMON events
- Drop events: The total number of drop events
- Bytes: The total number of bytes received
- Packets: The total number of packets received
- Broadcast packets: The number of good broadcast packets received
- Multicast packets: The number of good multicast packets received
- CRC alignment errors: The number of packets received with Cyclic Redundancy Check (CRC) errors
- Undersized packets: The number of received packets smaller than the minimum Ethernet frame size
- Oversized packets: The number of received packets larger than the defined MRU or MTU
- Fragments: The number of fragments received on the port
- Jabbers: The number of received oversized packets with a valid CRC
- Collisions: The number of collisions received
- Frames of 64 bytes: The number of 64-byte frames received
- Frames of 65 to 127 bytes: The number of 65 to 127-byte frames received
- Frames of 128 to 255 bytes: The number of 128 to 255-byte frames received
- Frames of 256 to 511 bytes: The number of 256 to 511-byte frames received
- Frames of 512 to 1023 bytes: The number of 512 to 1023-byte frames received
- Frames of 1024 to 1518 bytes: The number of 1024 to 1518-byte frames received
RMON
Remote network monitoring (RMON) supports LAN monitoring and protocol analysis by extending SNMP capabilities to provide comprehensive network traffic analysis and monitoring. On the RMON tab, you can configure RMON on Sophos Switch using lists for statistics, events, alarms, and historical network data, as well as logs for the collected data and triggered events.
Statistics list
The Statistics list table shows the following information about RMON entries on the switch:
- Index: The primary key that uniquely identifies RMON entries. SNMP management stations use this to reference specific RMON instances.
- Data source: Identifies the interface, SFP module, or LAG being monitored.
- Owner: A string that identifies who created the RMON entry. The string can be from 1 to 127 characters and can't include
",\,%,&,?,',!,;,|,+, or spaces.
To create a new entry, click Add, enter the required information, and click Save.
To remove an entry, click Delete.
Note
If an alarm references the index you're trying to delete, you'll get an error. You must either edit the alarms and change them to another index or click Fix conflicts, select the entries to remove, and click Remove selected alarm entries to delete the alarms along with the index.
Event list
The Event list table shows the following information about RMON events on the switch.
- Index: The unique identifier for the event entry.
-
Event type: The action the switch takes when the event occurs. It can be one of the following values:
- Nothing: Take no action.
- Log: Log the event.
- SNMP Trap: Send an SNMP trap.
- Log and Trap: Log the event and send an SNMP trap.
-
Community: The SNMP community for the SNMP trap.
- Description: A description of the event. The description can be from 1 to 127 characters and can't include
",\,%,&,?,',!,;,|,+, or spaces. - Owner: A string that identifies who created the event entry. The string can be from 1 to 127 characters and can't include
",\,%,&,?,',!,;,|,+, or spaces. - Last time sent: Shows the date and time that the event last occurred.
To create a new event, click Add, enter the required information, and click Save.
To update an event, click Edit ![]() , enter the required information, and click Save.
, enter the required information, and click Save.
To remove events, select the events you want to remove and click Delete.
Event log table
On Event log table, you can see information about specific event logs for the switch.
Choose an event index from the drop-down list to see the logs for that event index. The logs show the time the switch logged the event and a description of the event.
Alarm list
On the Alarm list table, you can configure the switch to monitor specific network variables and trigger events when values cross defined thresholds.
You can see the following information about your alarms:
- Index: The unique identifier for the alarm entry.
- Sample variable: The variable being sampled for the specified alarm.
- Sample interval: How often the switch checks the variable's value. The value must be between
1and2147483647seconds. -
Sample type: The sampling method for the selected variable and comparing the value against the thresholds. It can be Absolute or Delta.
- Absolute: The switch checks the variable's value at the specified interval.
- Delta: The switch checks for a change in the variable's value at the specified interval.
-
Rising threshold: The upper threshold that triggers the alarm when the sample value exceeds it.
- Falling threshold: The lower threshold that triggers the alarm when the sample value falls below it.
- Rising event: The event entry for the rising threshold.
- Falling event: The event entry for the falling threshold.
- Owner: A string that identifies who created the alarm entry. The string can be from 1 to 127 characters and can't include
",\,%,&,?,',!,;,|,+, or spaces.
To create a new alarm, click Add, enter the required information, and click Save.
To update an alarm, click Edit ![]() , enter the required information, and click Save.
, enter the required information, and click Save.
To remove an alarm, select the alarms you want to remove and click Delete.
History list
The History list tab shows the following information about collections of historical network data:
- Index: The unique identifier for the collection.
- Sample port: The port from which the samples are taken.
- Bucket requested: The number of samples to save. The range is from
1to50. - Interval: The frequency at which the switch takes samples from the port. The field range is from
1to3600seconds. - Owner: A string that identifies who created the entry. The string can be from 1 to 127 characters and can't include
",\,%,&,?,',!,;,|,+, or spaces.
To create a new collection, click Add, enter the required information, and click Save.
To update a collection, click Edit ![]() , enter the required information, and click Save.
, enter the required information, and click Save.
To remove a collection, select the collections you want to remove and click Delete.
Historical log table
On the Historical log table tab, you can see information about specific historical collections for the switch.
Choose a history index from the drop-down list to see the logs for that event index. The logs show the following information:
- Sample index: The unique identifier for the collection.
- Interval start time: The time at which the switch began collecting data.
- Drop events: The total number of packets dropped.
- Octets: The total number of bytes received.
- Packets: The total number of packets received.
- Broadcast packets: The total number of broadcast packets received. This number doesn't include multicast packets.
- Multicast packets: The number of good multicast packets received.
- CRC alignment errors: The number of packets received with CRC errors.
- Undersized packets: The number of received packets that are smaller than the minimum Ethernet frame size.
- Oversized packets: The number of received packets that are larger than the defined MRU or MTU.
- Fragments: The number of fragments received.
- Jabbers: The number of received oversized packets with a valid Cyclic Redundancy Check (CRC).
- Collisions: The number of collisions received.
- Utilization: The bandwidth utilization.