Threat lineage
You must have Sophos EDR, XDR, or MDR to use this feature.
About threat lineage
The threat lineage shows in graphic form the processes that led up to and triggered a detection. It helps you understand how the threat developed, where it impacted your environment, and what the results were.
View a threat lineage
You can access a threat lineage graph from a detection's details page.
-
Go to Threat Analysis Center > Detections.
Alternatively, go to Threat Analysis Center > Cases and select the Detections tab.
-
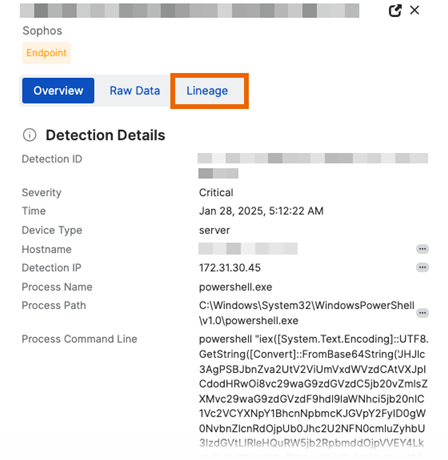
Find the detection you want and click anywhere in its row in the table.
The detection details pane slides out on the right of the screen.
-
Select the Lineage tab in the details pane.
If you don't see a Lineage tab, this detection doesn't support the new feature.
-
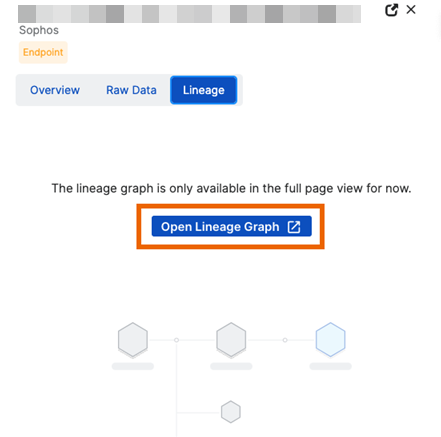
Click Open Lineage Graph.
-
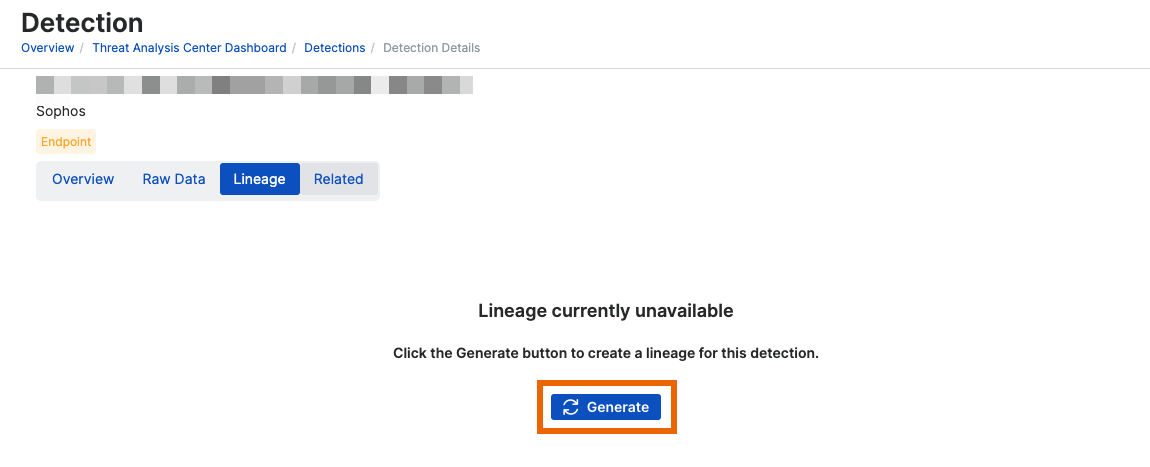
If there's no graph available yet, click Generate.
Note
If a detection generates a "case", a graph is generated automatically and will be available here already. For information on cases, see Cases.
A graph of the processes that triggered the detection and the processes that led up to them is shown.
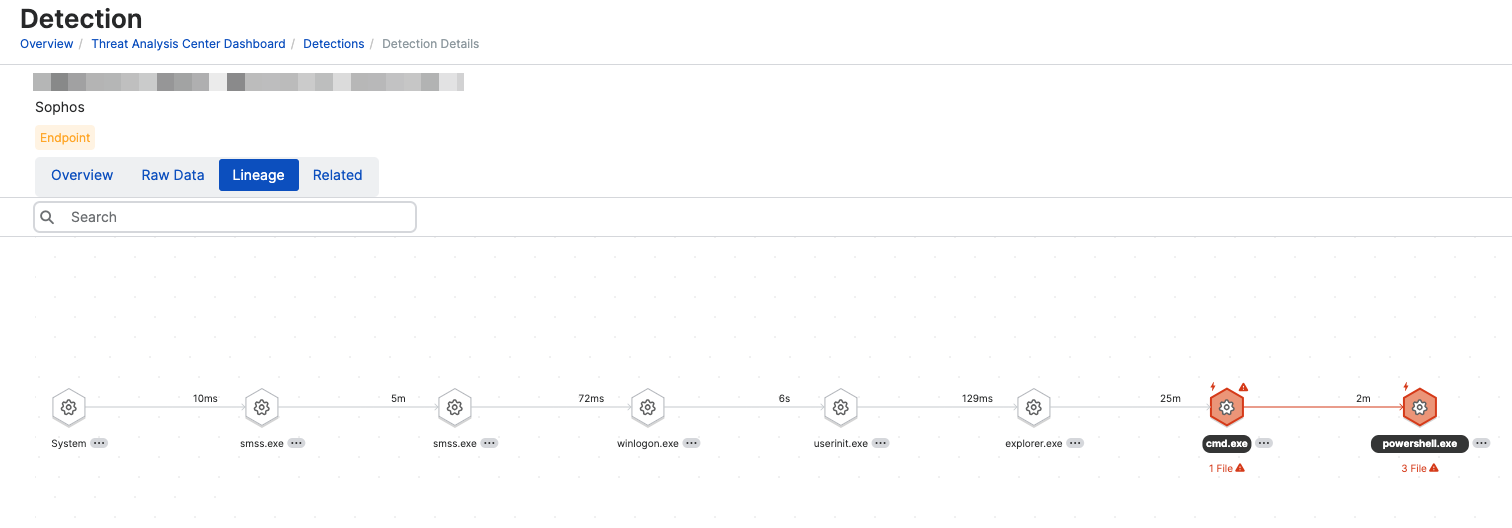
The lineage graph remains available for 7 days. You can regenerate it any time during the period that Sophos XDR Data Lake keeps the data, which is typically 90 days.
Key to the threat lineage
The threat lineage graph uses the icons below to represent processes and activity.
| Icon | Process | Description |
|---|---|---|
| Process | A process that led up to the detection | |
| Impacted process | Suspicious or potentially malicious process | |
| Detection Triggered | A process that triggered a detection | |
| Key activity | Pivotal actions that influence the progress or outcome of later events |
To see this list of icons and the number of each process type in the graph, click the Legend icon in the upper right of the page.
![]()
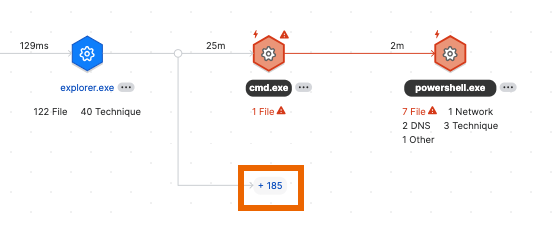
The graph can also show processes and activities that aren't in the direct lineage but were launched by a process in the lineage. These branch off the main graph, as shown here. To find out more about these, see Show more processes in the lineage.
See more details of a process
You can see more details as follows:
-
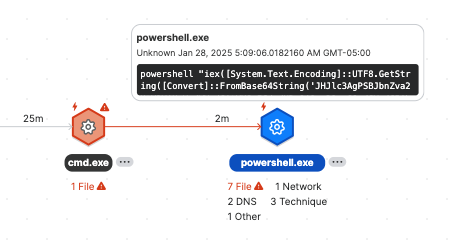
Hover over a process. This shows basic details and the command line.
-
Use the pivot options. Click the
 three dots next to the process. You can then select queries to run in Live Discover.
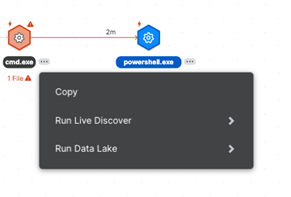
-
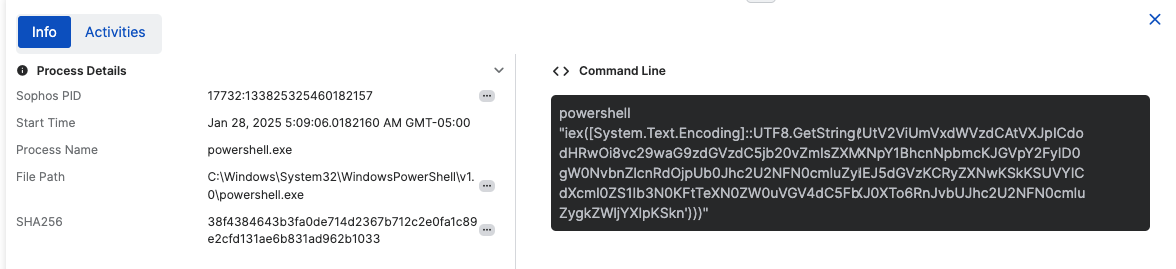
Click a process. This opens the Info and Activities tabs below the graph.
The Info tab shows process details and the command line. Click the
three dots beside a detail to use the same pivot options available in the graph.If you have Sophos AI features, click the AI icon
 to generate an analysis of the command line.
For details of the Activities tab, see See activities associated with a process.
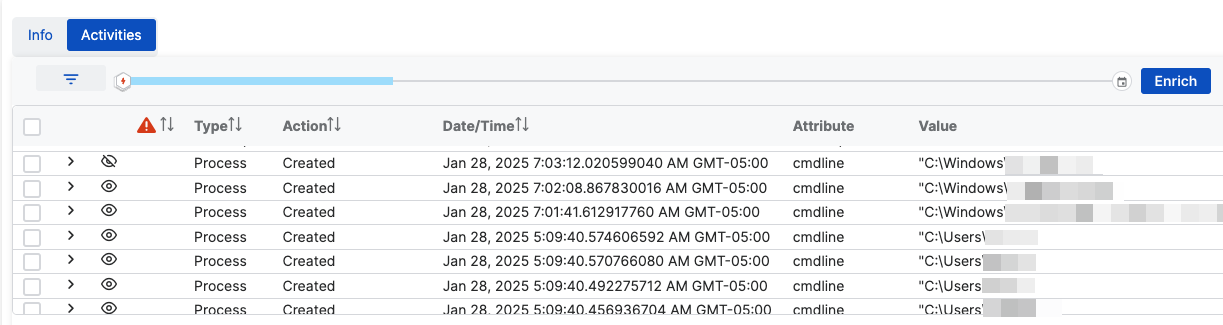
See activities associated with a process
You can see all the activities associated with a process. These activities include other, related processes that aren't in the lineage graph.
To see activities, do as follows:
- Click a process in the graph to open its details.
-
Select the Activities tab.
- If the lineage was generated automatically, and you're looking at an impacted process, the tab already shows activities.
- If you generated the lineage manually, the tab is initially empty. You must load data as described in the next step.
-
Click Enrich on the right of the tab to load data.
The first time you click Enrich, it shows the first three days of data, starting when the process started. Each time you click Enrich, another three days of data are added, and more activities are listed.
A pop-up at the start of the Enrich timeline shows the date and time of the Initial Detection.
You can change the information shown as follows:
- Expand a row to show the raw data.
- Filter activities by the type, the action, and more.
You can also add processes from this list to the lineage graph. See Show more processes in the lineage.
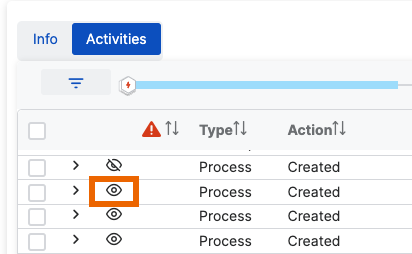
Show more processes in the lineage
The Activities tab in process details shows additional, related processes that aren't in the direct threat lineage.
You can add these processes to the lineage graph to help investigate threats.
- Click a process and open its Activities tab.
- In the list of activities, look for a related process that you want to show.
-
Click the Eye icon beside the process to show it. Click the icon again to hide the process.
Export the lineage
To export the lineage data to a CSV file, click the Export icon.
![]()
If an error occurs during export, select one of the processes in the graph and attempt the export from there.
Search the lineage
To search the lineage, enter a term in the search bar in the upper left of the page.
The matching results are shown in the Info, Activities, and Matching Results tabs at the bottom of the page.