Telemetry journey
You can monitor the collection and processing of data from products that are integrated with Sophos Central.
The telemetry journey shows the data's progress from threat detection through to arrival at the Sophos Data Lake.
See the telemetry journey
To see the telemetry journey, do as follows:
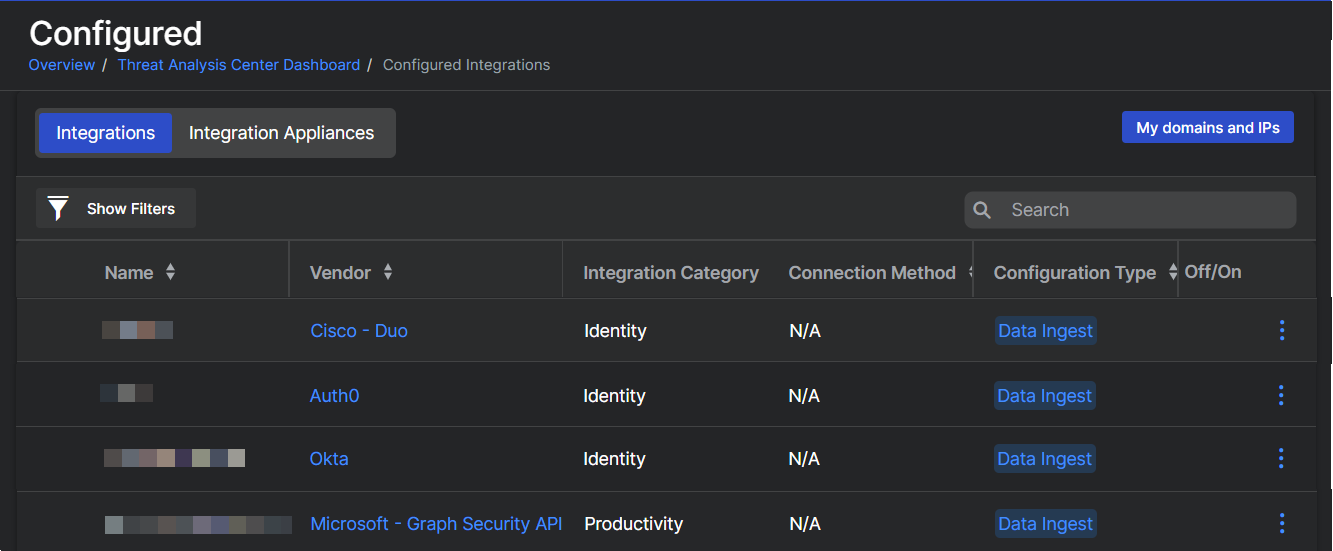
- Go to Threat Analysis Center > Integrations > Configured.
- Make sure the Integrations tab is selected.
-
Click in the row of the integration that you're interested in.
Note
Don't click the product name in the Vendor column. That opens a page for setting up and managing the integration.
-
The Telemetry Journey pane slides out from the right side of the page.
The Telemetry Journey pane shows events for the most recent 30-minute period. The data is refreshed every 15 minutes.
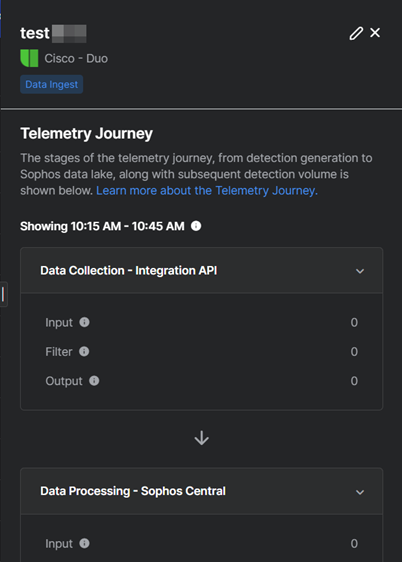
The data is divided into Data Collection and Data Processing tables, as described below.
Data collection
The Data Collection table shows the number of detection alerts received and filtered by the Sophos integration appliance, or via API calls in the case of cloud-based tools.
Input
Input shows how many detections were received.
This figure is the total number of events (syslog messages or API events) received before any filtering.
Filter
Filter shows how many detections were filtered out.
This figure is the total number of events dropped because they don't match the required format or content for the event source. Filtering significantly reduces the volume of non-security data that passes out of your network.
For details of the filters for each integration, go to Products, click the product, and look for Filtering in its overview page. Some products might not have this page available yet.
Output
Output shows how many detections were passed through. These continue to the data processing stage.
Data processing
The Data Processing table shows alerts forwarded to Sophos Central and processed before being put in the Sophos Data Lake.
Input
Input shows how many detections Sophos Central received.
This figure is the total number of syslog messages or API events reaching the data processing stage.
Filter
Filter shows how many detections Sophos Central filtered out.
This figure is the total number of events that were dropped because they don't match the necessary format or content for the detection source.
For details of the filters for each integration, go to Products, click the product, and look for Filtering in its overview page. Some products might not have this page available yet.
Volume throttle
Volume Throttle shows how many detections exceeded the system's rate limit.
If an integration sends too much data, volume throttling may occur to protect the system.
Requires reprocessing
Requires Reprocessing shows how many detections were sent to Sophos analysts for review. This can happen if a new detection type requires an update for our data parsers. After an update, Sophos Central reprocesses these detections.
Output
Output shows how many detections were written to the Sophos Data Lake.
More information
For more information about the integrations processing pipeline, see Integrations detection pipeline.