Getting started
You set up and access Appliance Manager from Sophos Central.
Set up Appliance Manager
When you create a new appliance, we set up the account you need to use Appliance Manager.
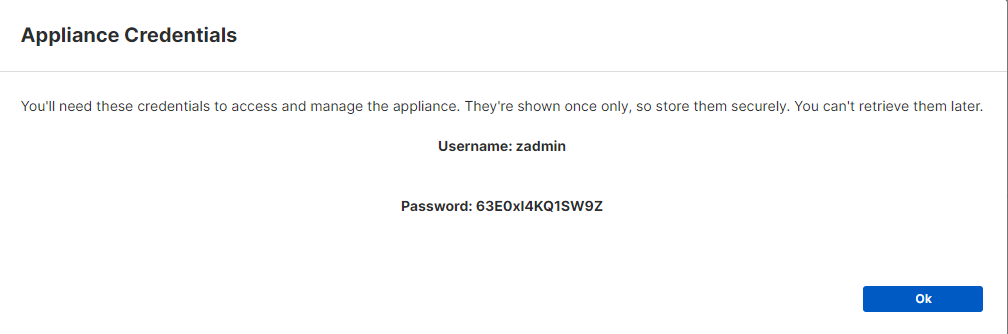
We show you the account details when you save your settings. The user name is zadmin and the password is shown in a pop-up message.
Store the password safely. It's only shown once.
We also set up accounts for existing appliances. The user name is zadmin and you'll be able to set the password the first time you open Appliance Manager.
Open Appliance Manager
After you deploy the appliance on a VM, you can go back to Sophos Central and access it as follows:
- In Sophos Central, go to Threat Analysis Center > Integrations > Configured.
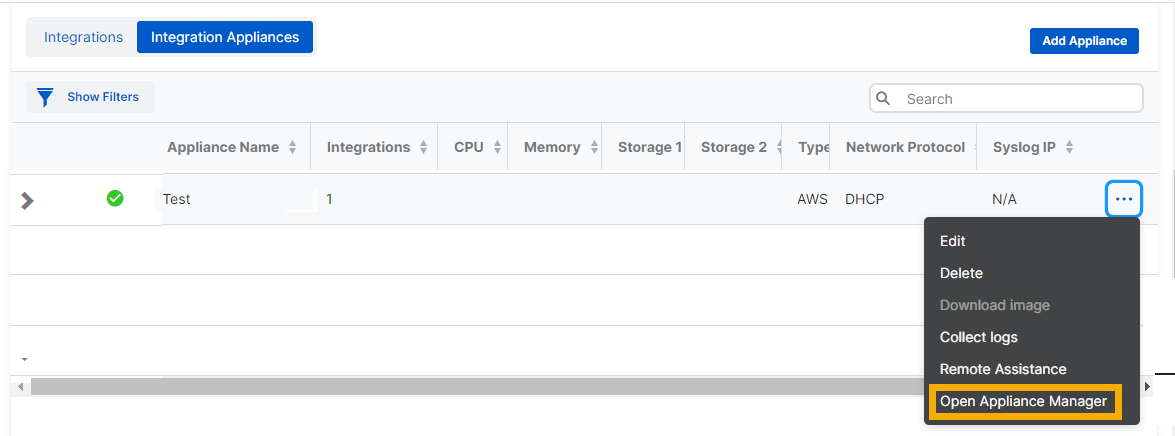
- Go to the Integration Appliances tab.
-
Find your new appliance. In the rightmost column, click the ellipsis (three dots) and select Open Appliance Manager.
-
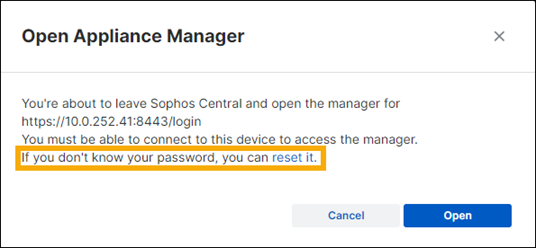
In the confirmation dialog, do as follows:
- If you're managing a pre-existing appliance, or you've forgotten the password, click reset it in the last line to set a password for Appliance Manager.
- Click Open.
Appliance Manager opens in a new window.
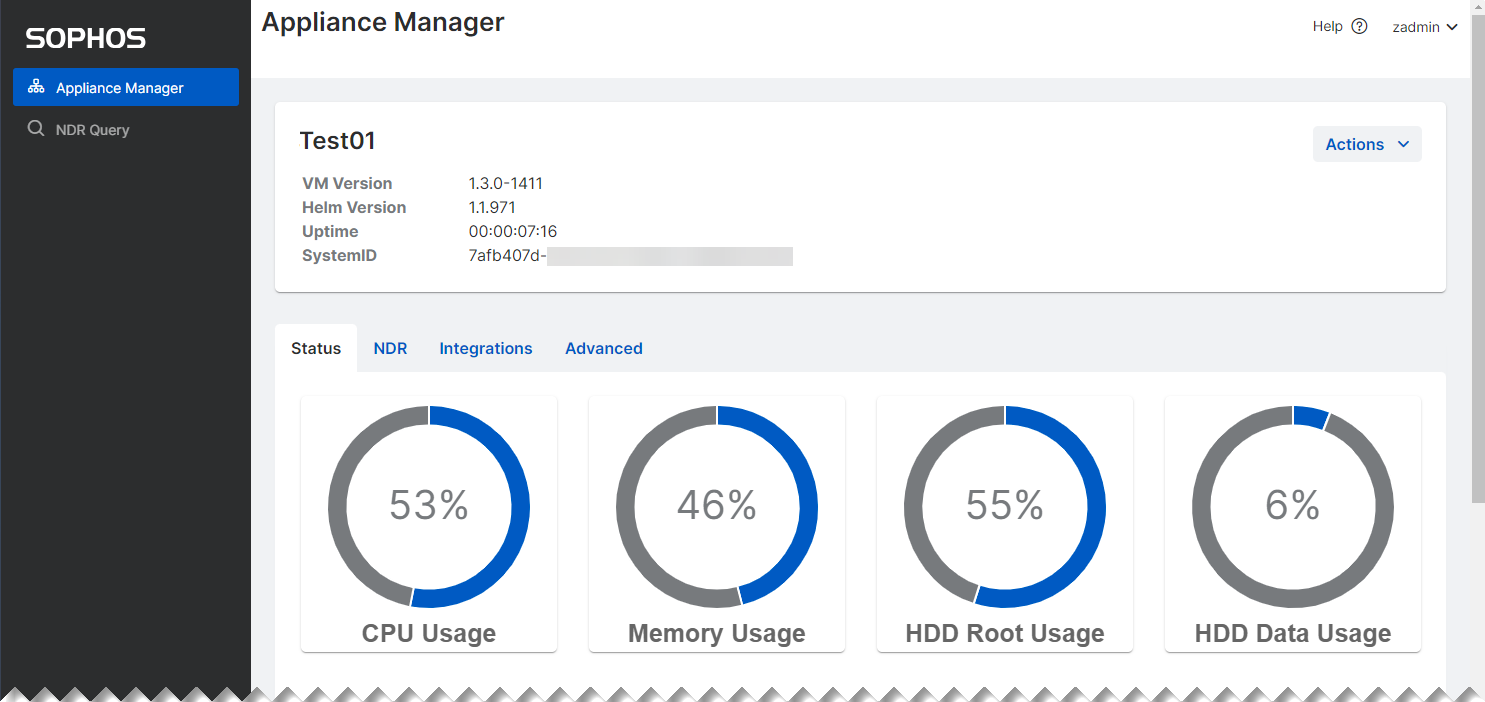
Appliance Manager dashboard
The Appliance Manager dashboard header shows the following information:
- Version: The version of the virtual appliance. This is a combination of all of the application container versions. For example
1.0-417. - K3S Helm Chart version: This software produces visualizations of the application containers running in the VA.
- Uptime: The amount of time that the VM has been running. The units are days, hours, minutes, and seconds. For example
000:00:02:54would represent 2 minutes and 54 seconds. - System ID: For example
4cfc4d56-b36b-9500-74ce-b1bdd7cf75e6.
Appliance Manager tabbed pages
Appliance Manager has four tabs for managing the appliance and integrations that run on it:
-
Status: This shows you system usage figures. See Status.
-
NDR: This lets you monitor and manage Sophos NDR. See NDR.
-
Integrations: This lets you monitor and manage third-party integrations. See Integrations
-
Advanced: This shows the status and restart times for the containers in which integrations run.
Appliance Manager settings
You can configure the management interface, proxy, SYSLOG, and SPAN settings used by the Sophos appliance.
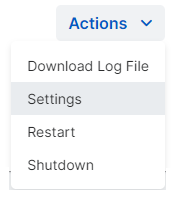
On the dashboard, click Actions > Settings to see the options.