Overview
The Overview page is a dashboard for a single investigation console. It shows indicators of compromise (IoCs), network traffic, IoCs by severity and type, IoC geolocation, and recent flow detections.
To see the Overview page in Sophos Fusion, go to My Products > NDR. Under Investigate, select Overview.
At the top of the page, select the investigation console you want to view data for. The page shows data from the last 24 hours by default.
Filters
Click the Filter icon in the top left of each section to open a panel that shows Saved Templates and Filter Builder.
Select a template, then click Apply. The filter only applies to the dashboard section where you opened the filter panel.
To create a filter that you can save as a new template, do as follows:
- Click the time range drop-down and select a preset date range, or select Custom to define a date range.
- Click Add Field and select a field. To find a field, enter its name in Search.
-
Select an operator and select or enter a value. For example, select DestIp, Equals, and enter
10.10.10.10.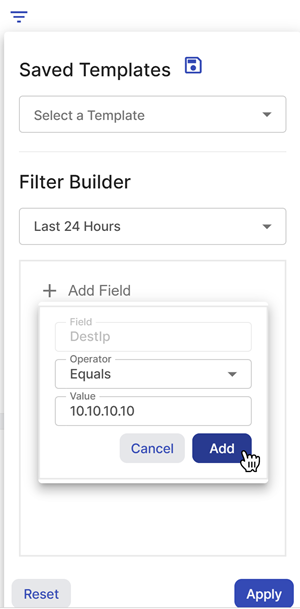
You see different options depending on which field you select. If you select a numeric field, you can use operators such as =, <, and >=.
-
Click Add.
- Click the Save icon and select Save As.
- Enter a name for the filter, then click Save.
- Click Apply to apply your filter.
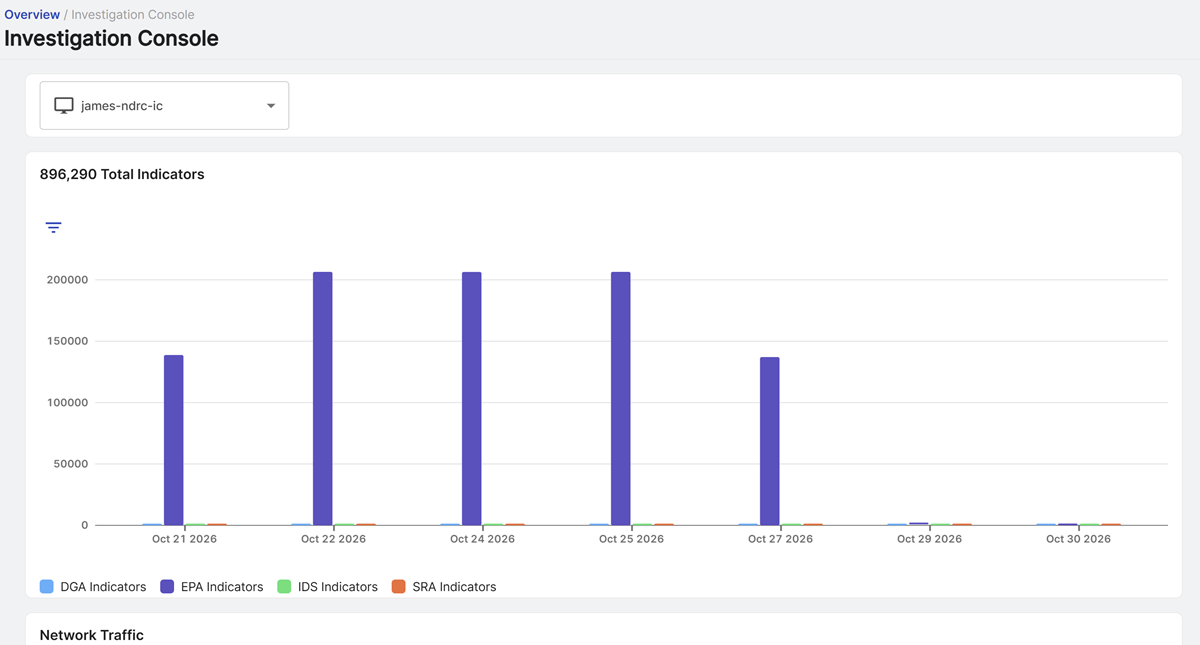
Total Indicators
The bar chart shows the total IoCs in the selected date range.
The chart shows the following indicator types:
- DGA: Domain Generation Algorithm
- EPA: Encrypted Payload Analytics
- IDS: Intrusion Detection System
- SRA: Session Risk Analytics
Click an indicator type to show or hide it on the bar chart.
Hover over the bars to see the information for a specific date and time.
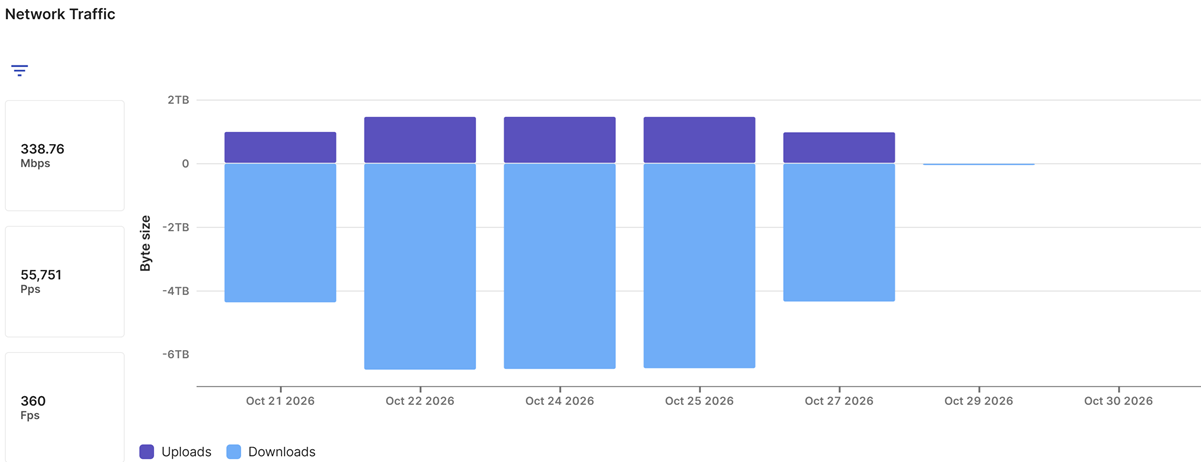
Network Traffic
The bar chart shows uploads and downloads over time. The left side of the chart shows the following network traffic information:
- Network speed (data transfer rate) in megabits per second.
- Packets transferred per second.
- Flows (connections) per second.
Hover over a bar to see the network traffic values for a specific date and time.
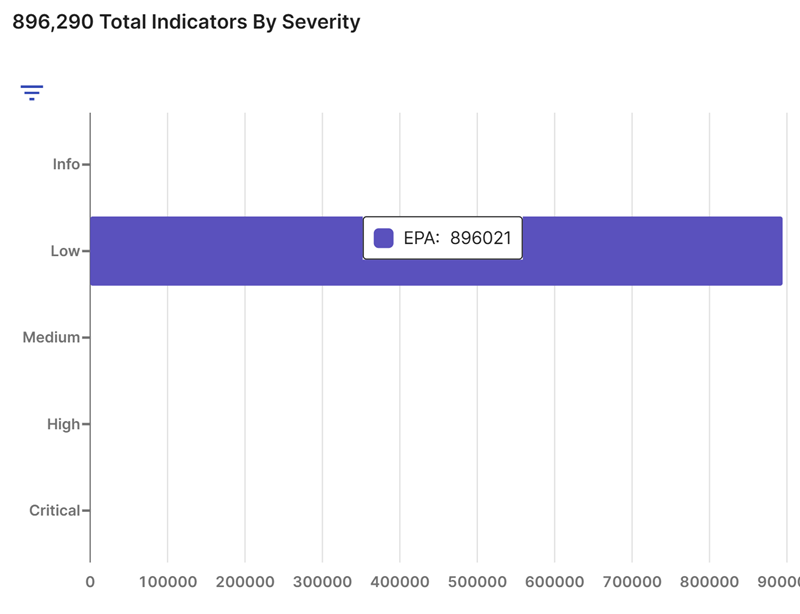
Total Indicators By Severity
The bar chart shows the number of IoCs for each of the following severities:
- Critical
- High
- Medium
- Low
- Info
Hover over the bars to see the category and the number of IoCs in that category.
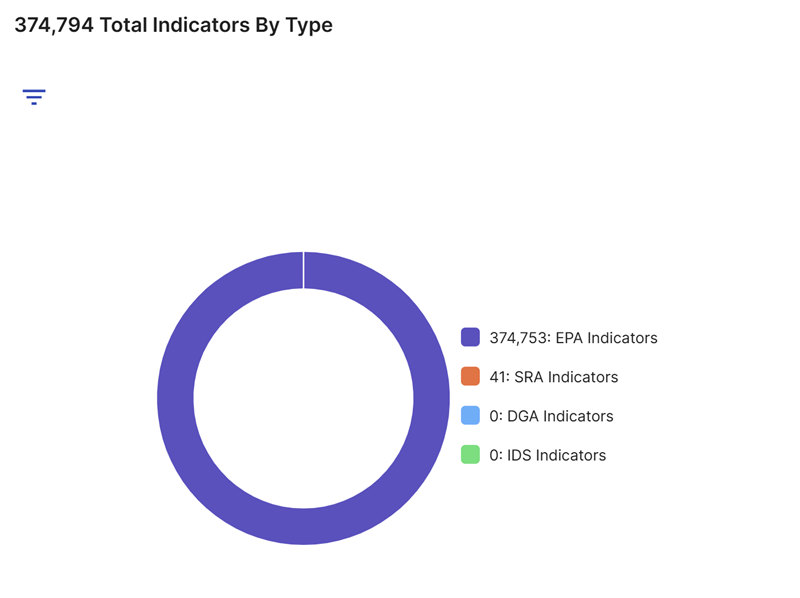
Total Indicators By Type
The donut chart shows the total number of IoCs by type.
Hover over a donut segment to see the percentage for that IoC type.
Geolocation Map
The geolocation map shows locations associated with IoCs based on their IP addresses. Hover over a colored circle to see the number of IoCs at each severity in that region.
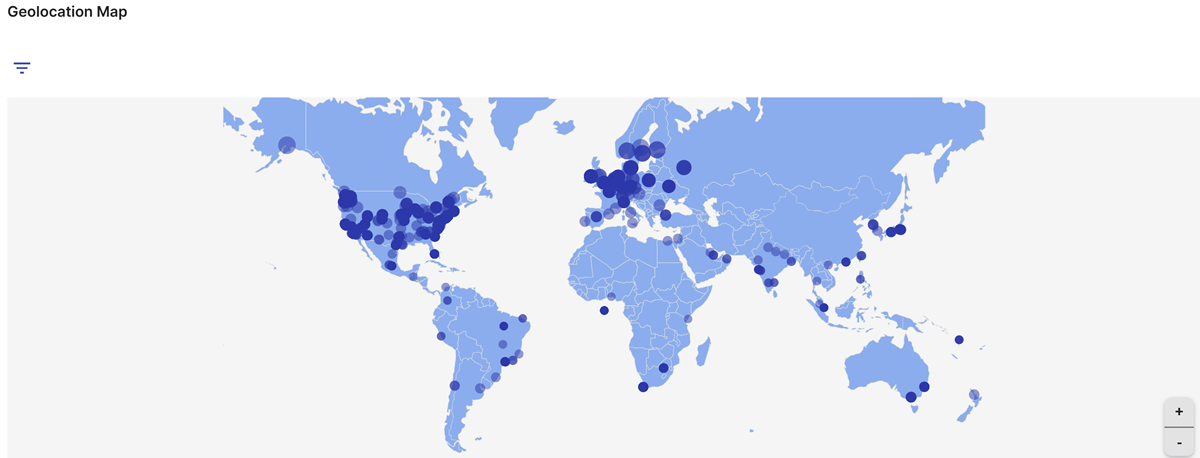
Use the map controls to zoom in and out. Drag the map to move around it.
Recent Detections Table
The table shows details about your recent network flow detections. Scroll right in the table to see all columns.
- Click the Filter Fields drop-down and select the columns you want to show.
- The table shows up to 1,000 results. If you have more results, click the Filter icon and narrow your search.
- Click Export CSV to save the table as a CSV file. The file contains the rows shown in the table, up to 1,000 rows. It doesn't include all indicators in the selected date range.