NDR Dashboard
The NDR dashboard shows analytics generated by appliances using a mode that includes NDR. Appliances using an IDS-only or IPS-only mode don't provide data to the dashboard.
For details about appliance modes, see NDR appliance modes.
View the dashboard
To view the NDR Dashboard, go to My Products > NDR > Dashboard.
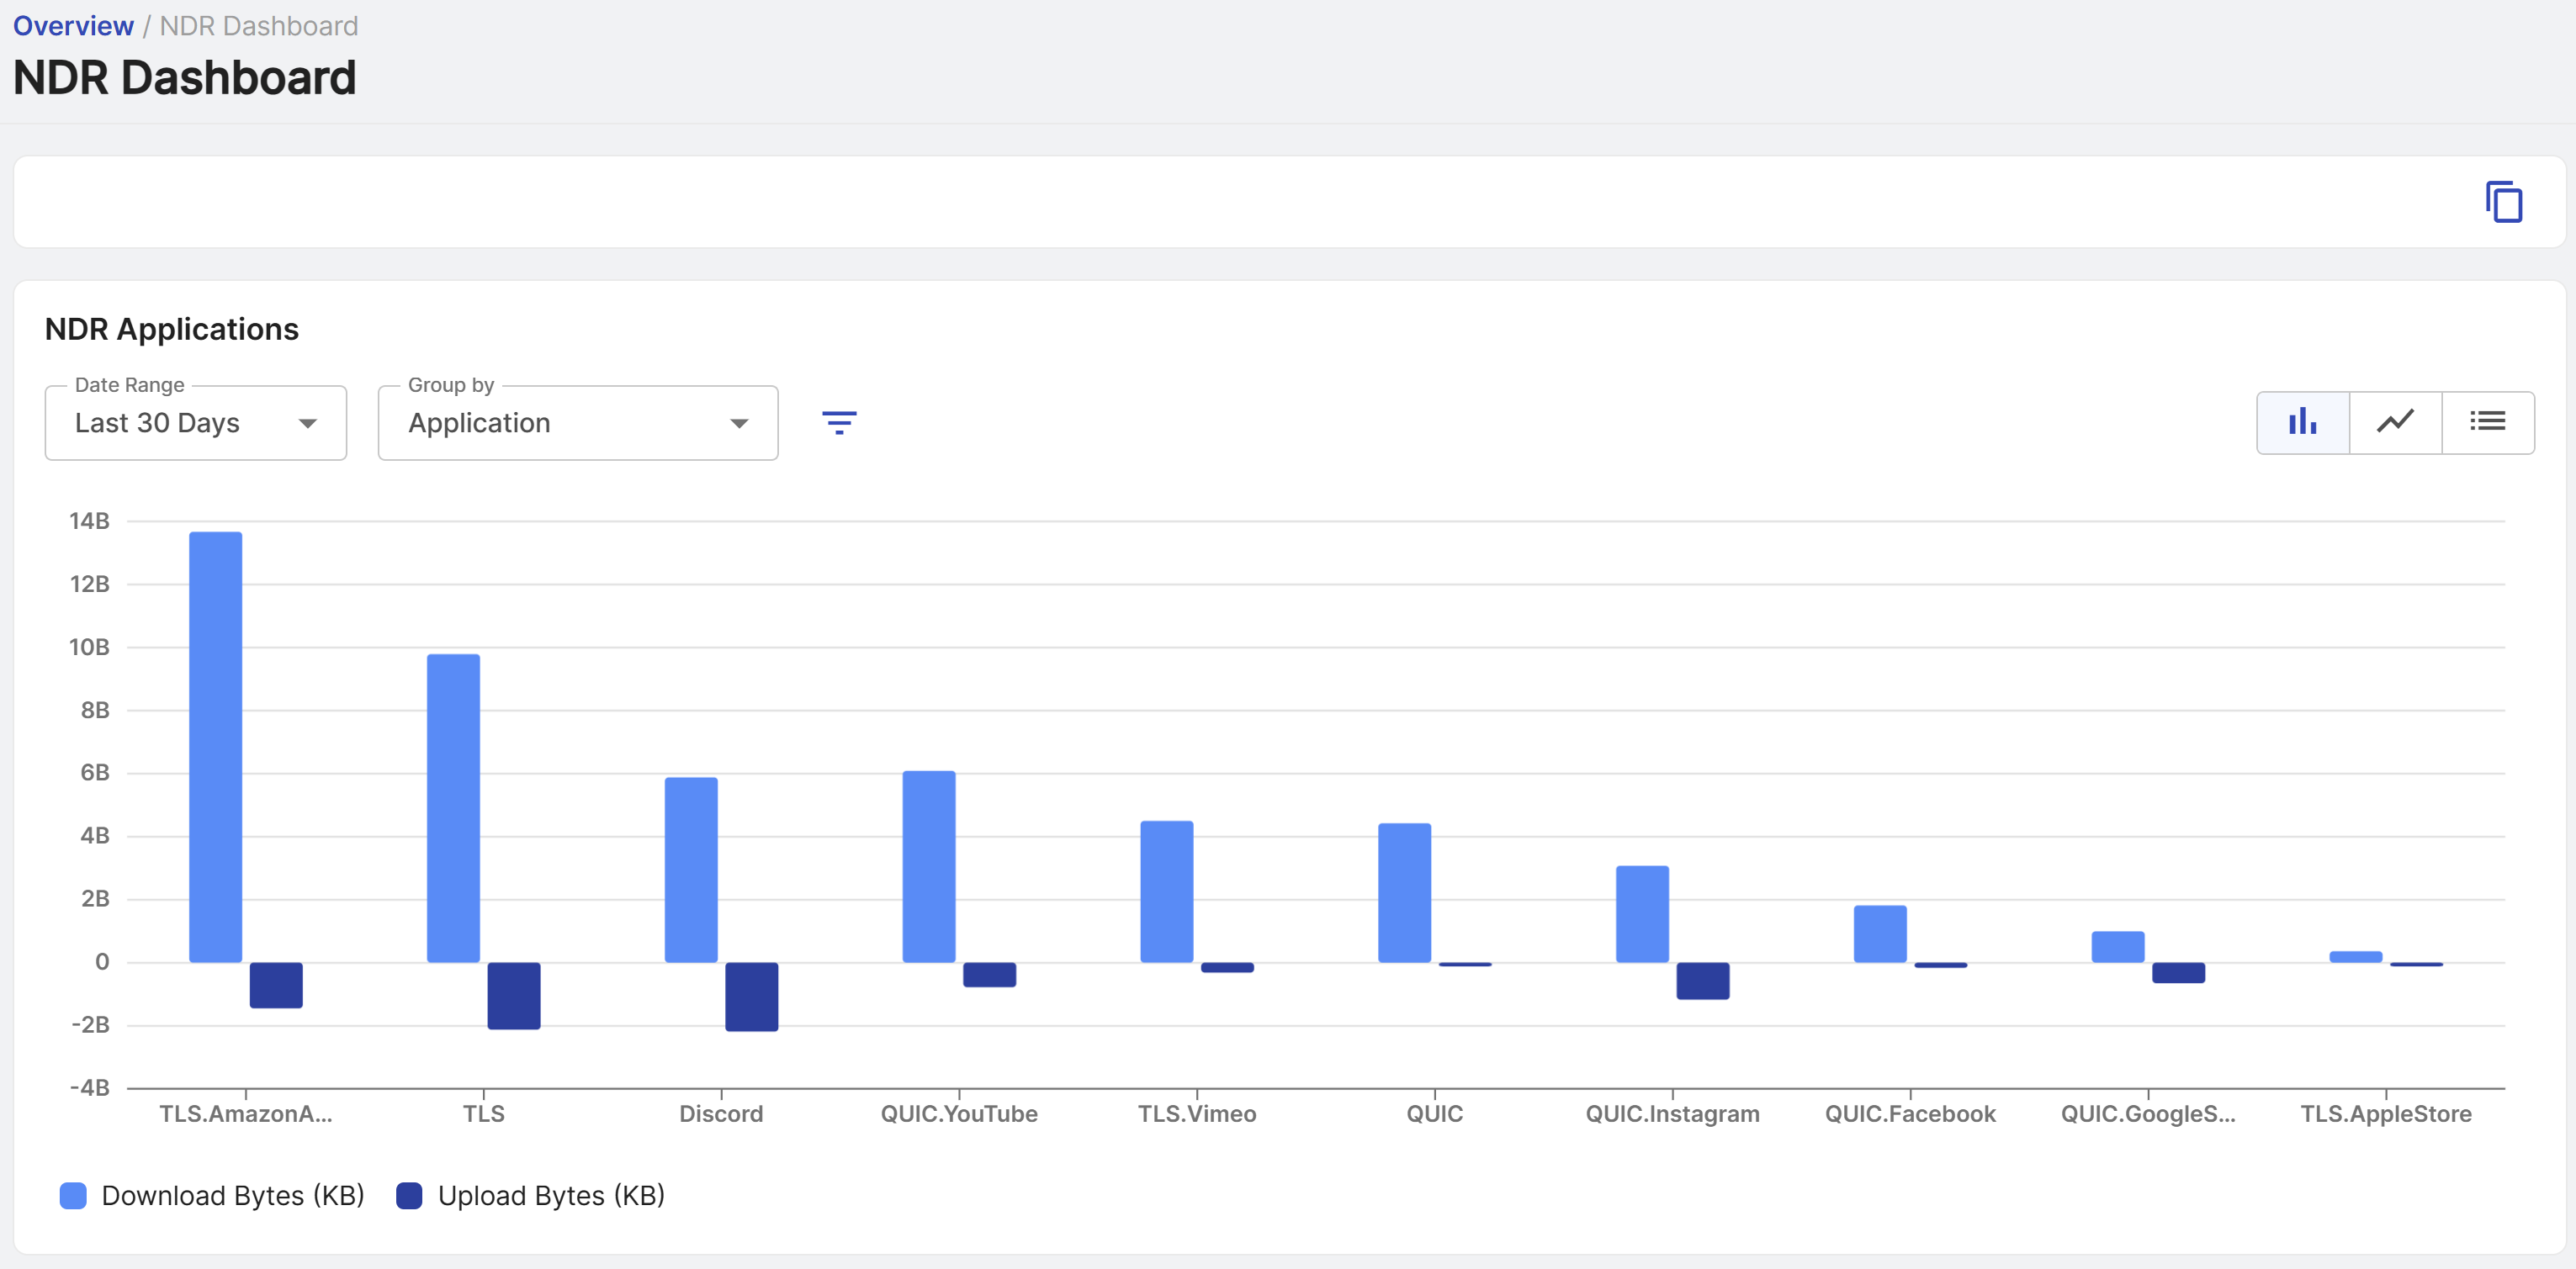
The dashboard includes the following widgets:
- NDR Applications: Shows network traffic volume by application or network protocol, including downloaded and uploaded data.
- NDR Detections: Shows NDR flow detections.
- NDR Devices: Shows managed and unmanaged device information based on the observed MAC address.
- NDR High Traffic Sources: Shows devices that have generated the most traffic.
Date range
You can change the date range used by the widgets.
In Date Range, select the last hour, 24 hours, 7 days, or 30 days. The default is 24 hours.
To set a custom time range, select Custom, then select dates from the calendar.
Change the widget type
You can change how each widget displays its data. Click the icon for the widget type you want:
| Icon | Widget type |
|---|---|
| Line graph | |
| Bar chart | |
| List | |
| World map |
Filters
To filter a widget's data, do as follows:
- Click the Filter icon .
- Click a filter to expand its options.
- Select the options you want and enter any required information, such as an IP address or MAC address.
-
Click Apply.
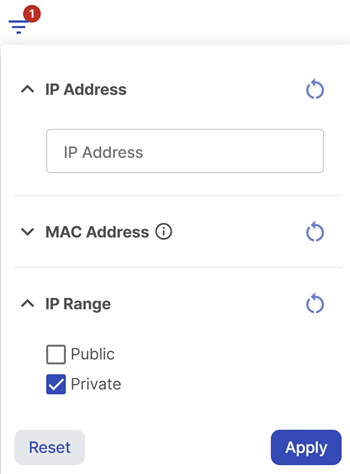
To clear the filters, click Reset in the Filters menu.