MDR Dashboard
The Managed Detection and Response (MDR) dashboard shows our team's work to deliver the MDR service and protect your organization. It summarizes threats we've recently detected, investigated, and mitigated for you, shows your current account health summary, and more.
To see the MDR dashboard, sign in to Sophos Fusion and go to My Products > MDR.
Tip
Click Classic MDR Dashboard to see data from legacy Sophos MDR. For details, see Classic MDR Dashboard.
Account Health Summary
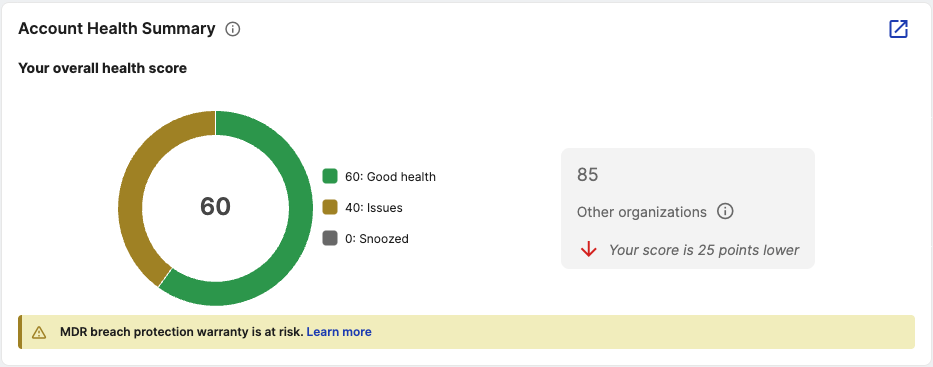
The Account Health Summary widget shows your current overall account health score out of 100.
If your score is less than 100, click the New Tab icon or the issue count in the graph to go to the Account Health Check page, which shows your account health details and recommendations to improve your overall score.
The page also provides a comparison of your score with those of other organizations in your region with a similar number of devices.
If you have MDR Plus and your score is less than 100, a message that the MDR Breach Protection Warranty is at risk also shows. For details, see Breach Protection Warranty for MDR Plus.
MDR Event Pipeline
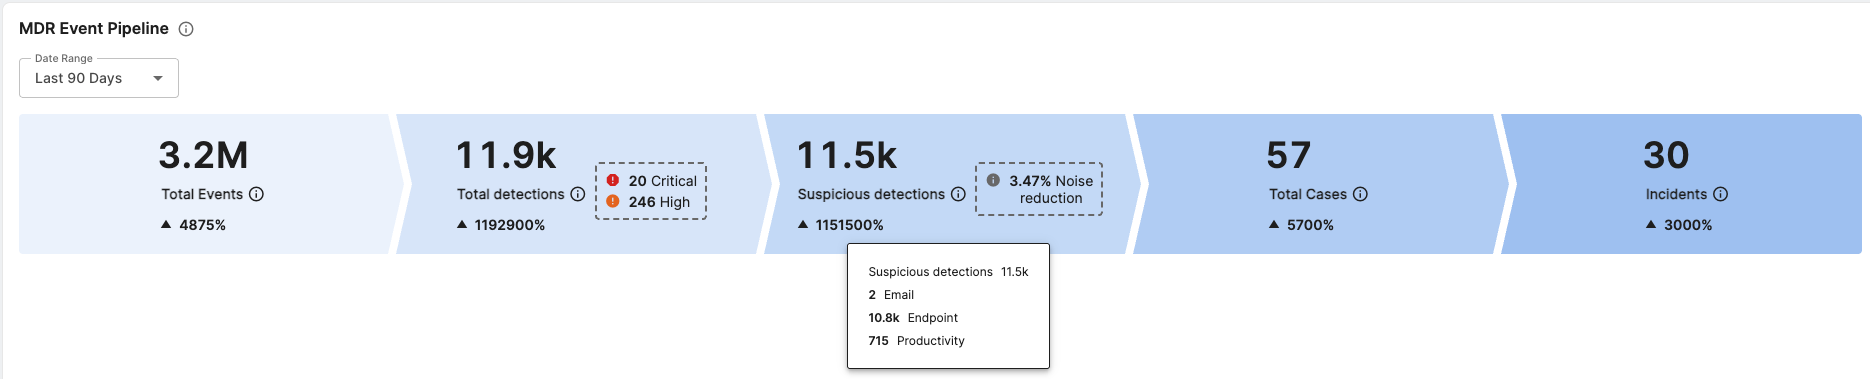
The MDR Event Pipeline widget shows the lifecycle of the data we receive and generate detections from for the selected date range.
We use continually updated detection rules to reduce noise and increase focus on the most important detections: those with indicators of suspicious behavior. These detections automatically create cases that our MDR Ops team investigates and escalates if needed.
You can see the noise reduction as a percentage next to the total number of suspicious detections.

Hover over each segment for a breakdown of events, detection sources, suspicious detection types, and auto-generated cases.
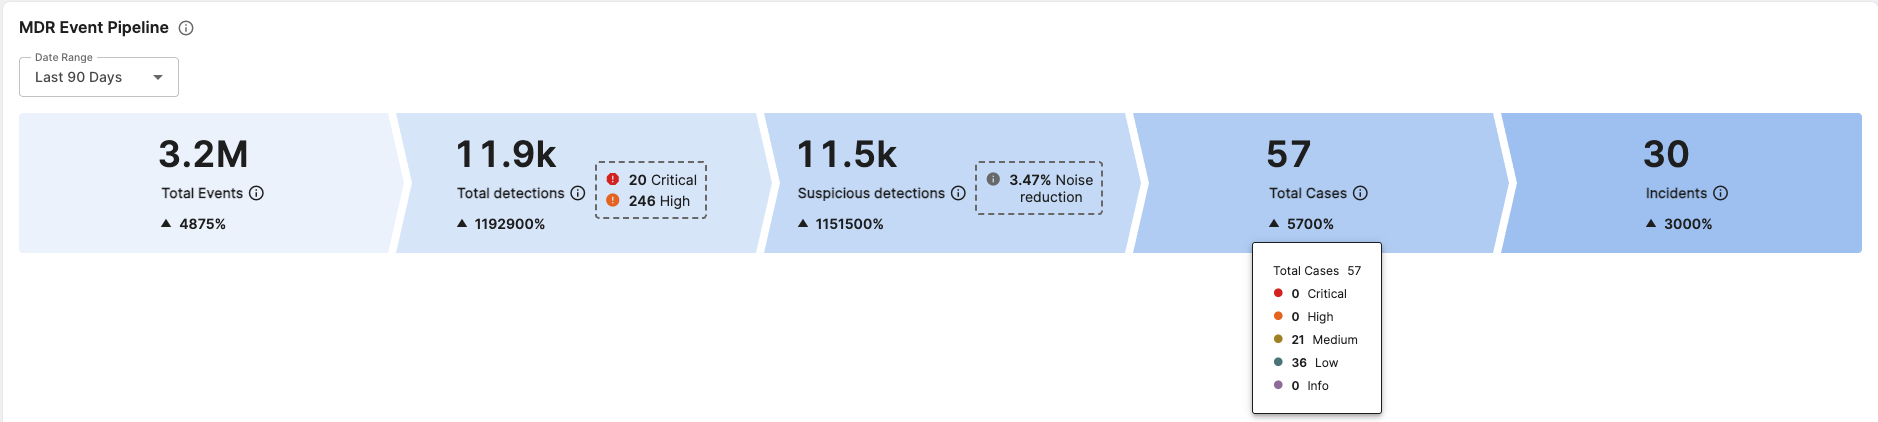
Click any detection- or case-related segment to view the corresponding details.
- The Detections page shows detections from the past 30 days.
- The Cases page shows both auto-generated and manually created cases.
- Use the filters on both pages to further manage your lists.
MDR Case Summary
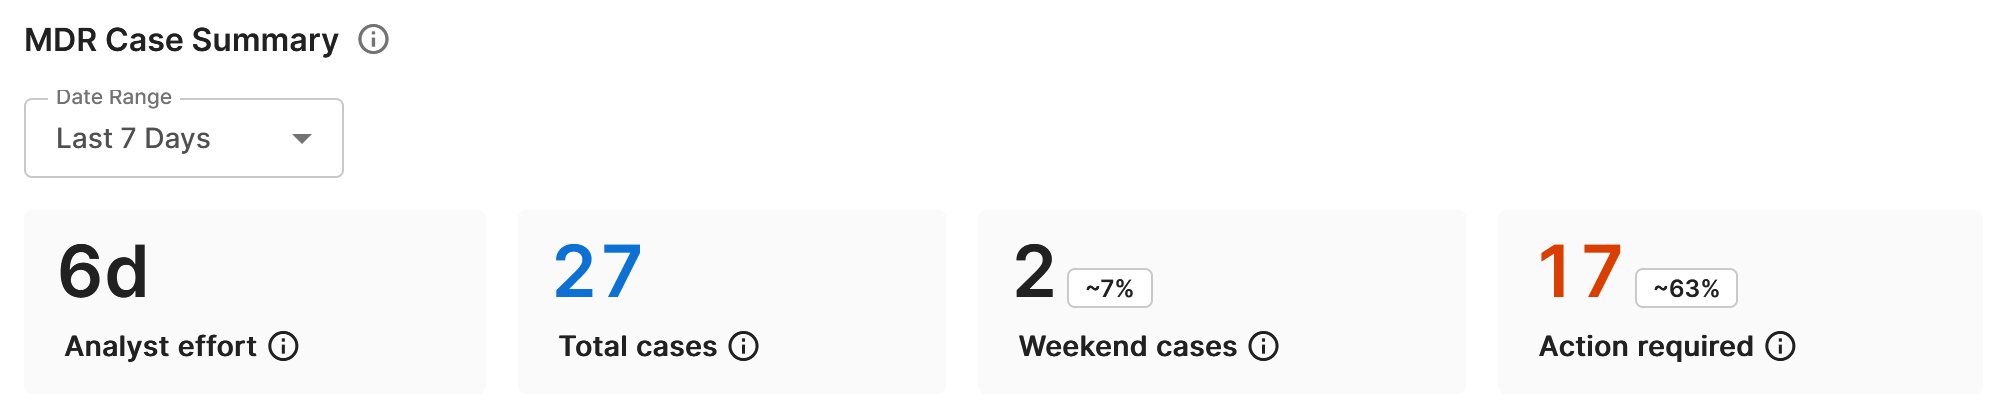
The MDR Case Summary widget shows the following metrics for the selected date range:
- Analyst effort: The amount of time our MDR analysts spend as they conduct detailed investigations on your detections and cases. This effort also includes the time they spend performing a wide range of response actions on your behalf to remotely disrupt, contain, and fully eliminate the adversary identified during the case investigation.
- Total cases: The number of cases from all sources.
- Weekend cases: The number of cases created over the weekend. You can expect lower numbers due to less user activity over the weekend. However, adversaries are still active on weekends, so our MDR analysts continue to monitor and respond to these cases 24/7.
- Action required: The number of Sophos-managed cases that currently require your input or action.
Click a card to go to the Cases page.
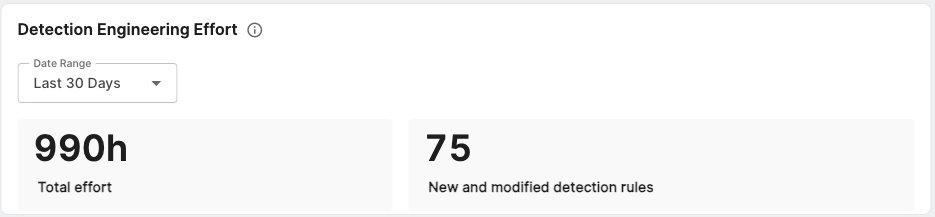
Detection Engineering Effort
The Detection Engineering Effort widget shows the following data for the selected date range:
- Total effort: The combined, approximate hours worked by a small subset of our detection engineering team. This team, which is one of many, creates and maintains security analytics to improve threat detection. All MDR customers see the same numbers because everyone benefits from this effort.
- New and modified detection rules: The total number of new and modified detection rules written by a subset of our detection engineering team. All of these rules are focused on third-party integration threat detection use cases.
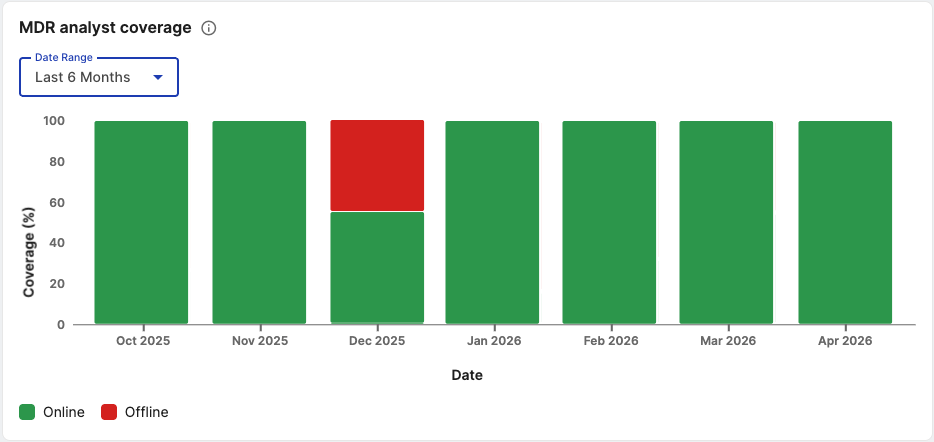
MDR analyst coverage
MDR is a 24/7/365 service. This chart shows the analysts' online status and availability in a 24-hour period, indicated with green.
To ensure that we always have someone available and actively looking after our MDR customers' incoming cases and detections, we check for a minimum of three active online analysts per eight-hour shift in a 24-hour period.
Total Cases
The Total Cases widget shows our standard case metrics with different grouping options. This provides clear visibility into different types of cases generated for your environment, broken down by severity, status, case type, management type, and more.
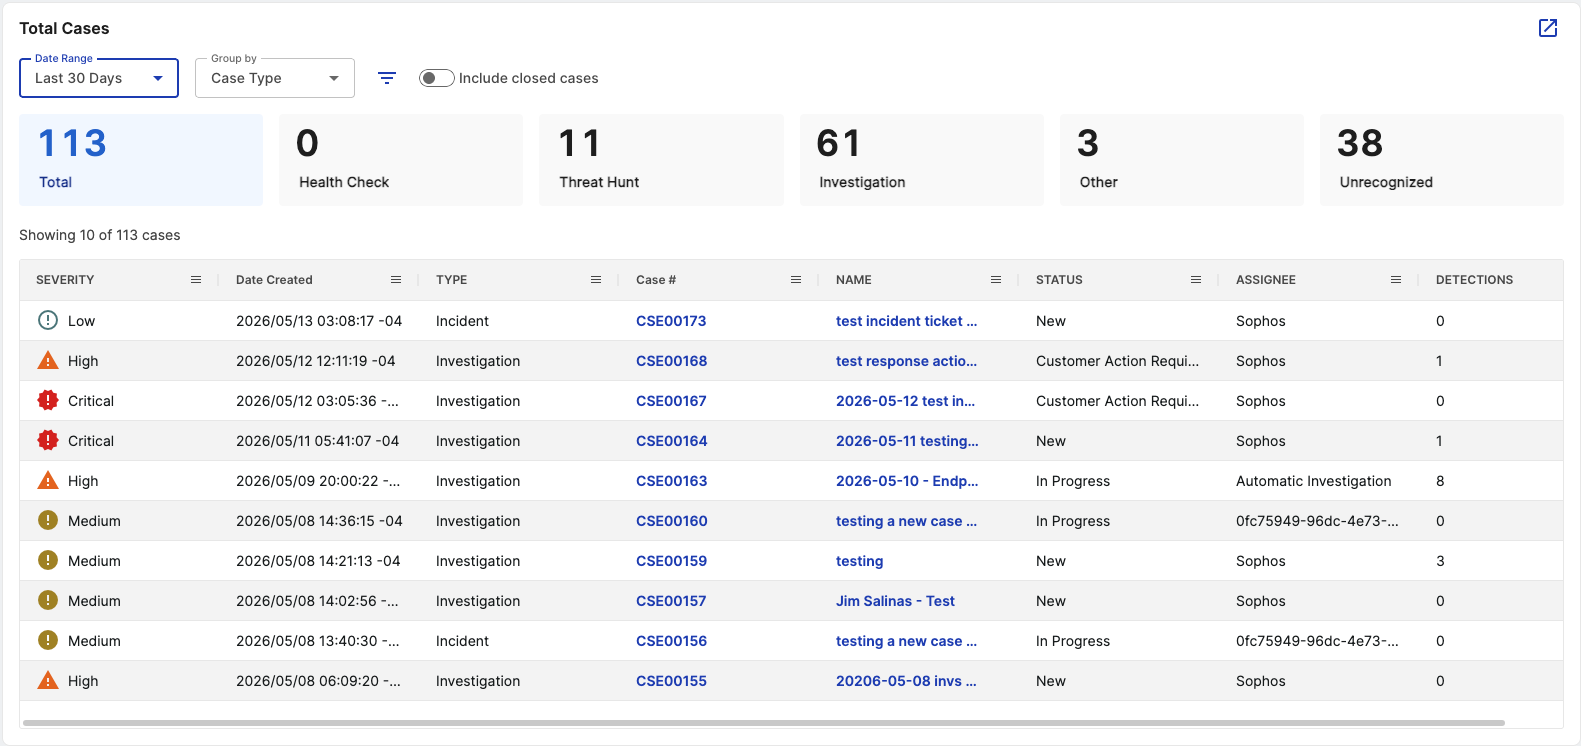
Click any count of cases to filter the table below the chart, or use the Filter menu .
Click the New Tab icon to open the Cases page. For details, see Cases.
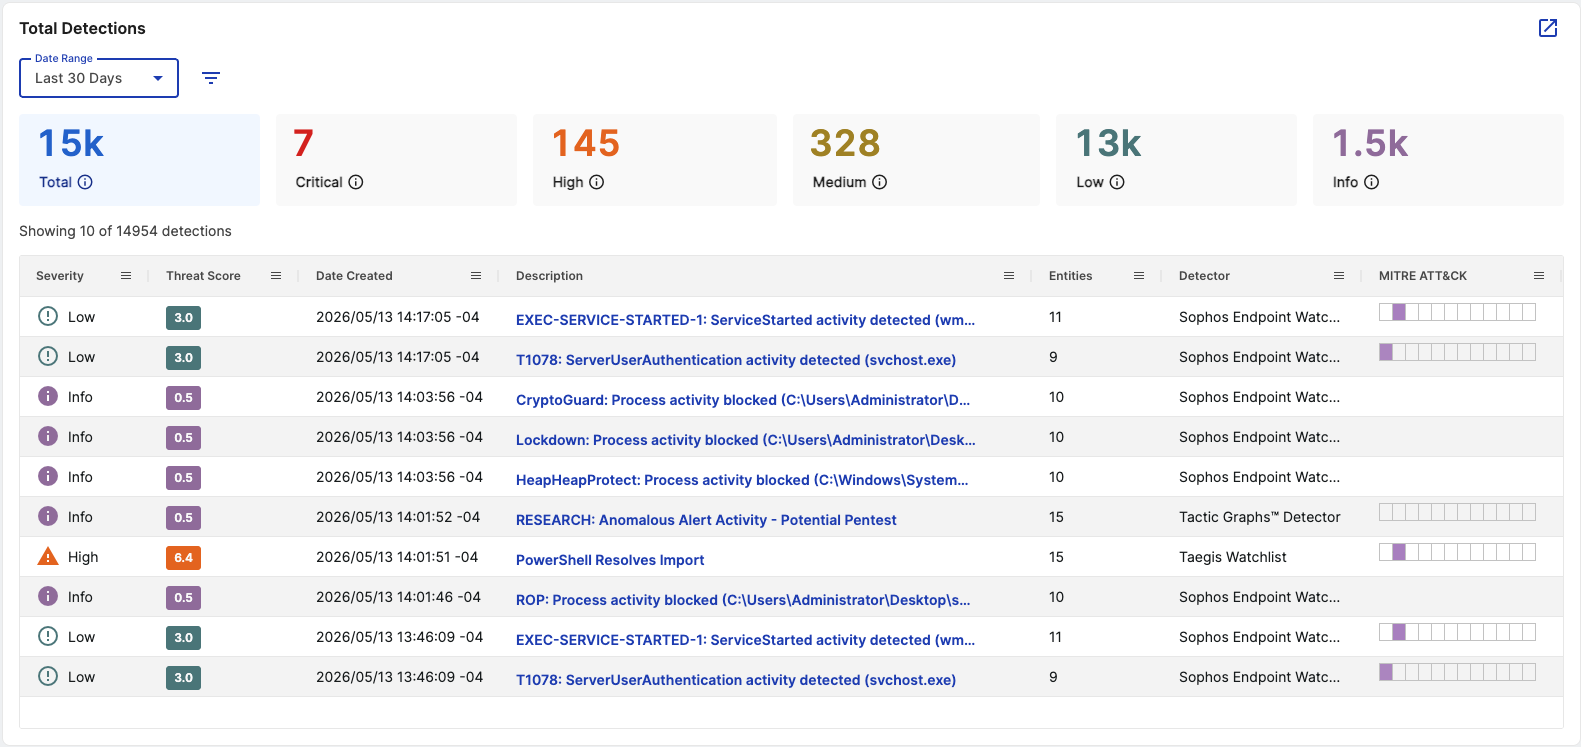
Total Detections
The Total Detections widget shows the total number of detections with a breakdown by severity level.
Click any count of detections to filter the table below the chart, or use the Filter menu .
Click the New Tab icon to open the Detections page. For details, see Detections.
Total Cases Count
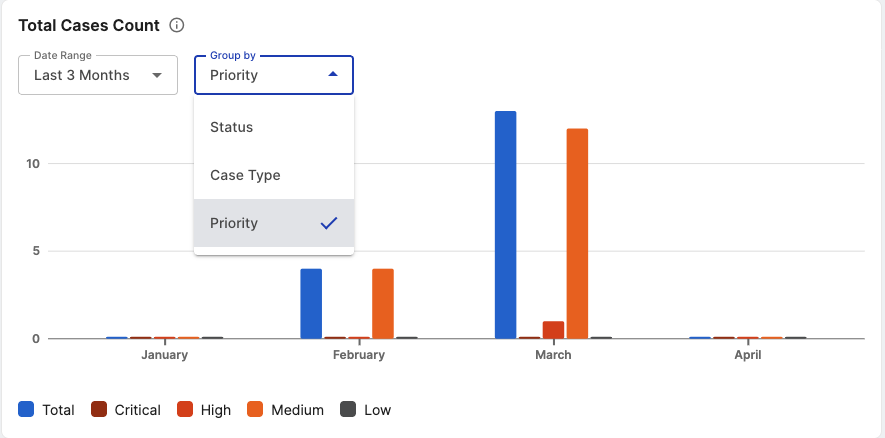
The Total Cases Count widget shows the number of manually created and automatically generated cases during the selected date range, grouped by severity, status, case type, management type, and more.
Click one or more criteria below the chart to add or remove them.
Click the New Tab icon to open the Cases page. For details, see Cases.
Total Detection Count
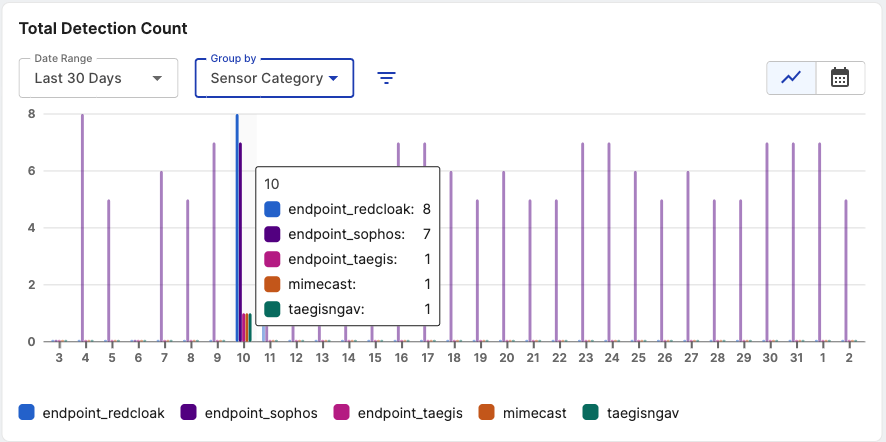
The Total Detection Count widget shows the number of detections during the selected date range, grouped by total count, sensor category, severity, or MITRE Tactics. It also shows a trend for the total count, based on the average counts per hour or day.
The trend line is shown only for time ranges up to seven days when grouped by total count.
Click the New Tab icon to open the Detections page. For details, see Detections.
Show a breakdown of detection numbers
You can customize the Total Detection Count graph to show a breakdown of the detection numbers. For example, you can show detection numbers broken down according to their severity: Critical, High, Medium, Low, or Info.
To do this, go to the drop-down menu above the chart and select the feature you want to see a breakdown for.

When you do this, each bar is replaced with a group of bars. If you select severity, separate bars show the detection numbers for Critical, High, Medium, Low, and Info. Hover on a bar to see the numbers.
Select graph or heatmap view
You can view the detection numbers as a graph or as a heatmap calendar. The default is graph view. To change to the heatmap calendar, click the Calendar icon .
Top 10 Entities
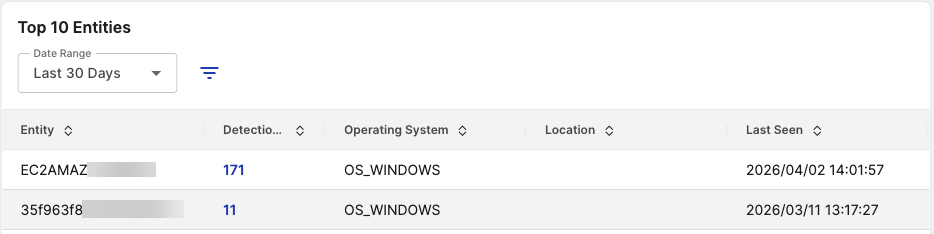
The Top 10 Entities widget shows the ten entities with the most detections in the selected date range. Hover over the number to see the risk level breakdown. Click the number to open the Detections page. For details, see Detections.
Click the Filter menu to refine entities shown in the widget.
Top 10 Users
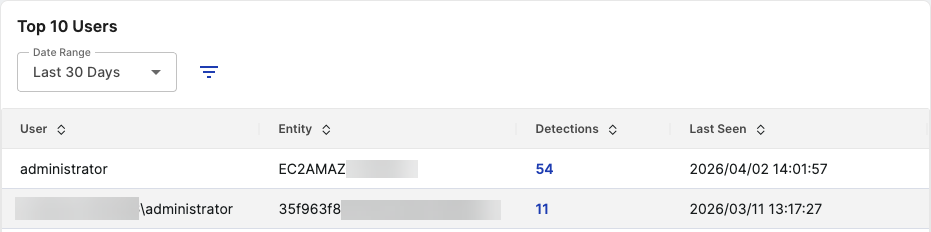
The Top 10 Users widget shows the ten users with the most detections in the selected date range. Hover over the number to see the risk level breakdown. Click the number to open the Detections page. For details, see Detections.
Click the Filter menu to refine users shown in the widget.
Recent Queries
The Recent Queries widget shows recent queries run on your data for investigation and threat hunting. It includes the last 24 hours of Data Lake Search queries and the last two hours of Live Endpoint Search queries. For details, see Search.

Help with dashboard widgets
Hover over the Information icon to see tooltips to help you get familiar with the widgets and their content.
All the widgets in the new MDR Dashboard are also available in the Sophos widgets gallery to use for creating your custom dashboards. See Create or edit a dashboard.
Export dashboard
You can export a dashboard snapshot as a PDF and use it as a report. For details, see Export dashboards to PDF.