Detection details
Sophos XDR detectors create detections from events that are unusual or suspicious. Review the detection details to determine if the activity should be investigated further.
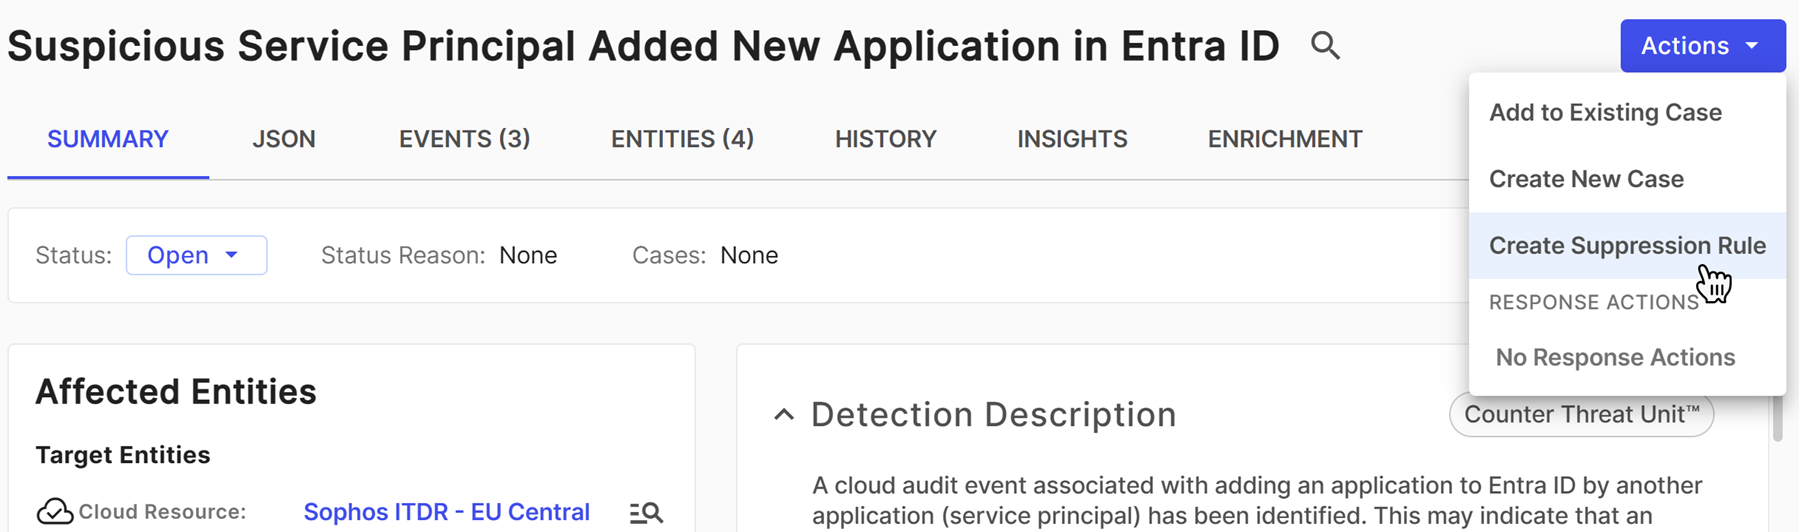
Select a detection from a table in Sophos XDR, such as on the Detections page or in search results, to see some of its essential details in a slide-out. This lets you continue browsing the table without losing your place or your filters. To see the full detection details, click the New Tab icon .
Note
Some detections are prefixed with RESEARCH to show that the detector or mechanism that generated the detection is in research mode as part of our process to verify the feasibility of the detection and the false positive rate.
Summary tab
At the top of the Summary tab, you can see the detection's status, the reason provided for that status, and any cases the detection has been added to. For details on changing the detection status, see Resolve detections.

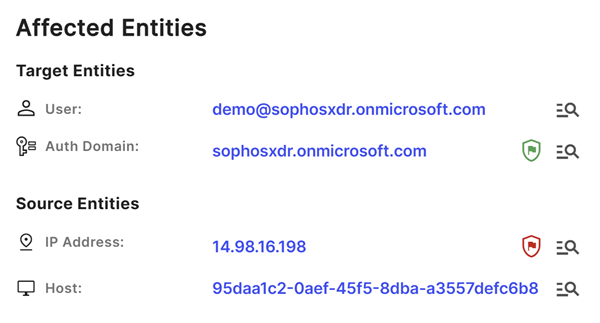
Affected Entities
The Affected Entities section shows details of target and source entities within the detection. You can take the following actions from this section:
- Click an entity to open its details page, which lists all the details we know about it. See Entities for details.
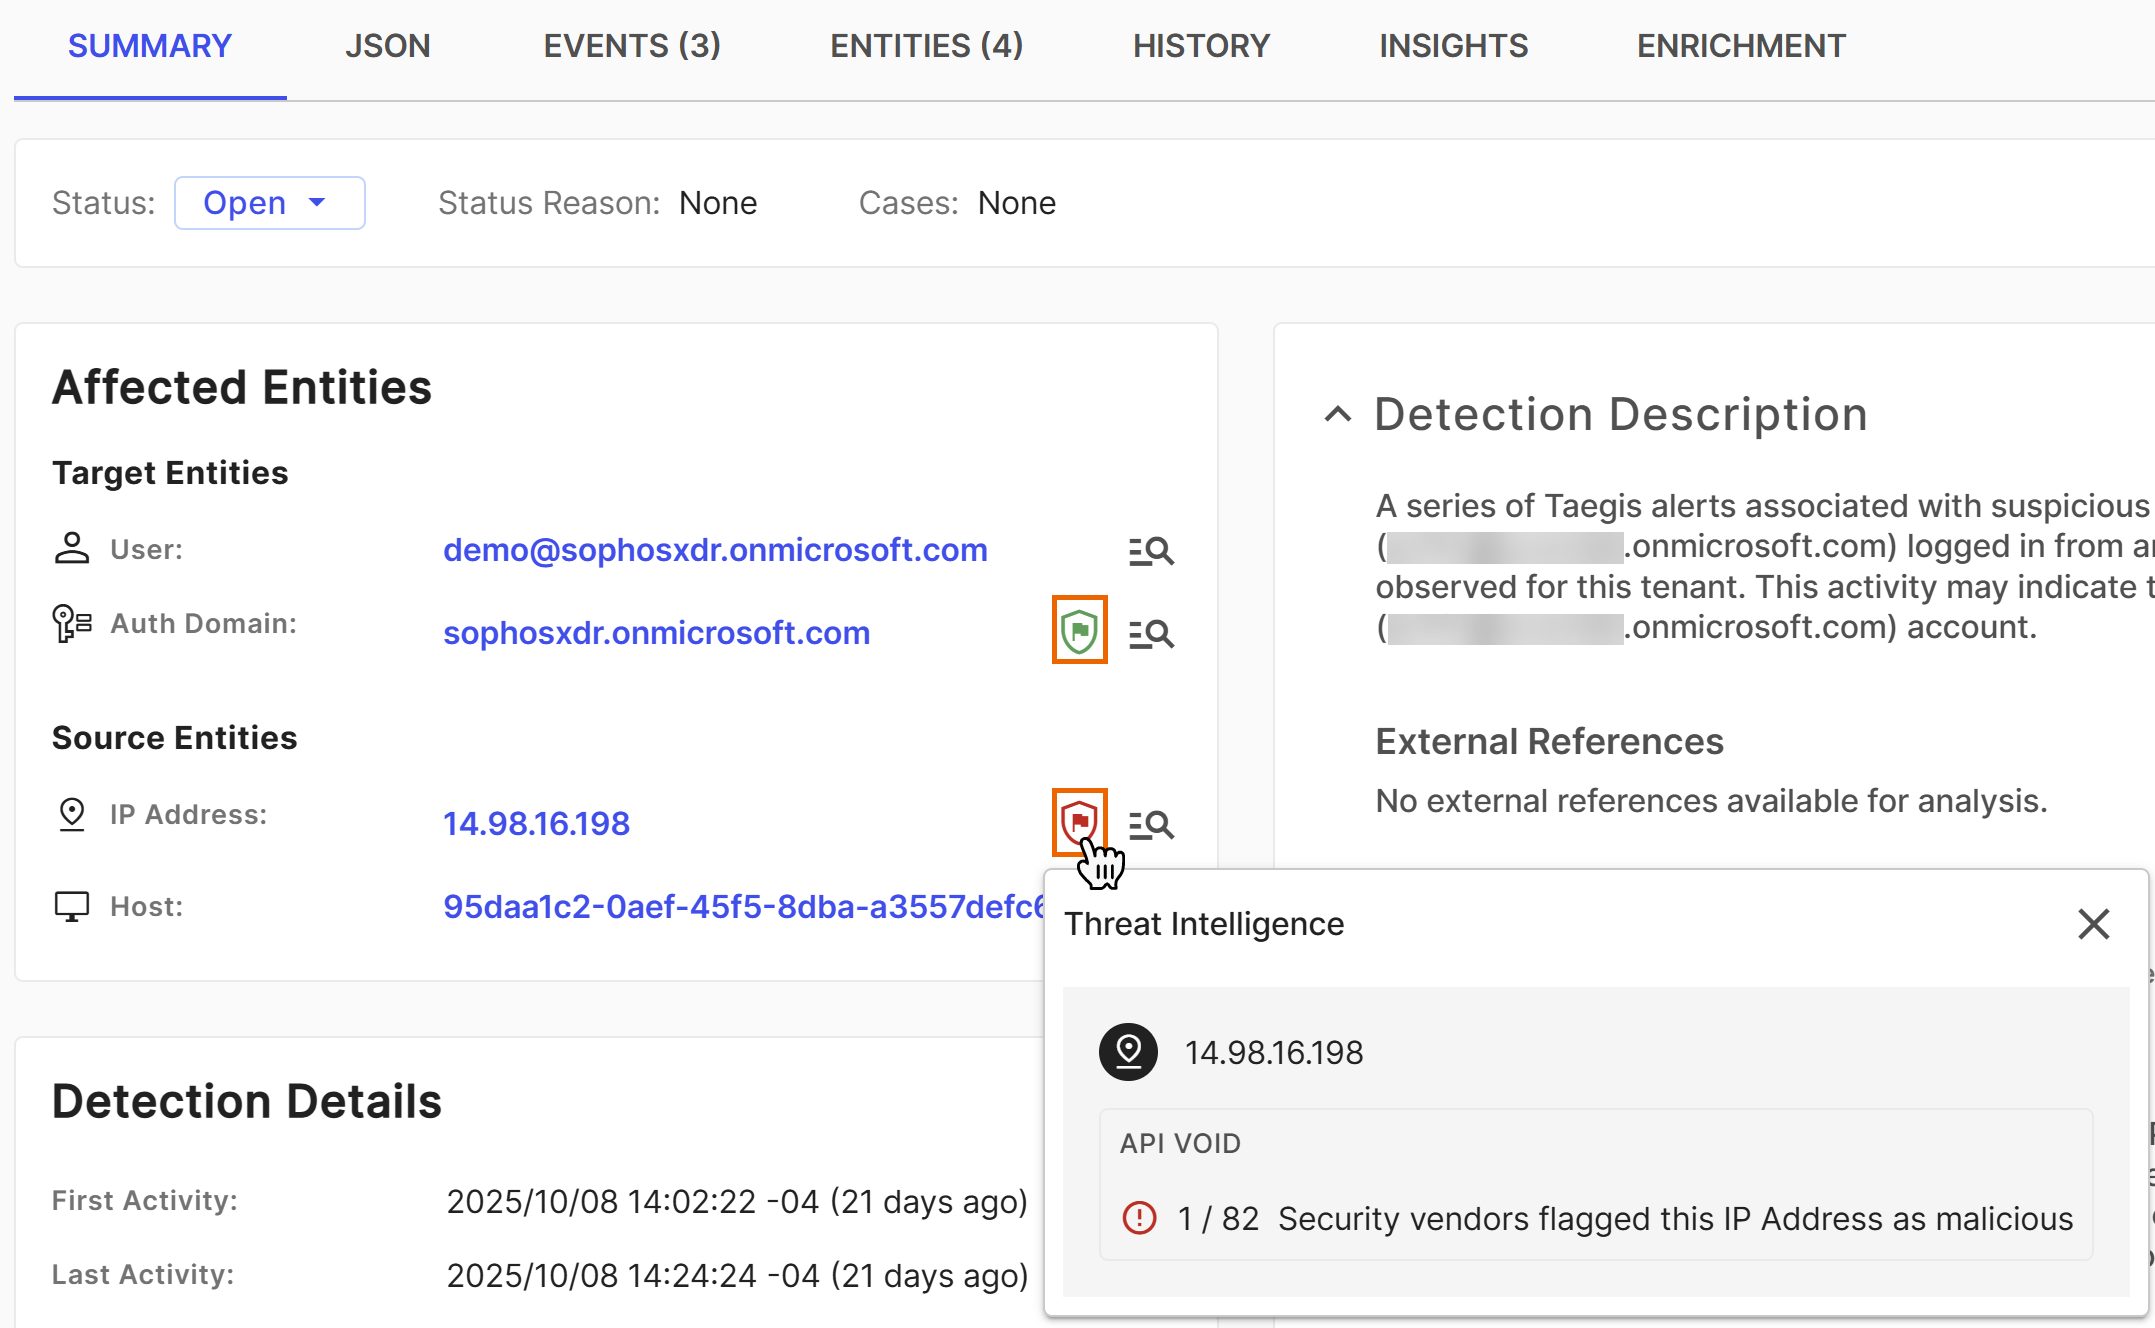
- Click a Shield icon to see available threat intelligence. See Detection enrichment for details.
- Click a Magnifying Glass icon to run a pivot search against it for further triage. See Pivot search for details.
Detection Details
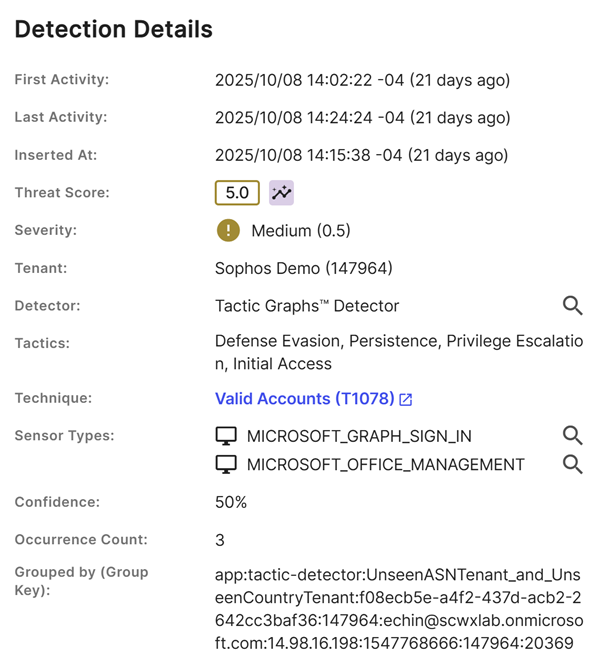
Depending on the type of detection, the Detection Details section may contain the following information:
- First and Last Activity: The first and most recent event occurrences.
- Inserted At: The date and time that the events were logged.
- Threat Score: A context-aware priority value assigned to the detection. For details, see Threat Score.
-
Severity: A measure of the potential threat the activity poses to your environment. The greater the score, the greater the potential threat posed by the activity. For details, see Detection severity and confidence.
Note
A message shows if the detection's severity has changed.
-
Detector: The detector that created the detection. For details, see Detectors.
- Confidence: A measure of how confident we are that the detection is accurate and represents malicious activity. The greater the score, the more confident we are that the detection indicates genuine malicious activity. For details, see Detection severity and confidence.
Detection Description
The Detection Description section provides a summary of the detection curated by the Counter Threat Unit™ (CTU).
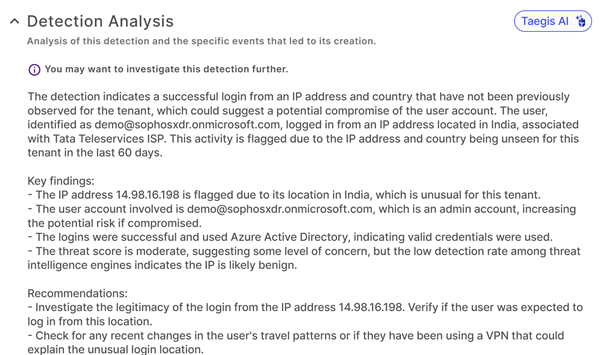
Detection Analysis
The Detection Analysis section uses Taegis AI to review the detection logic and associated events and then summarizes the detection in straightforward language. It helps you quickly understand and respond to security detections by prioritizing detections, providing context, and suggesting actions.
Review the generated summary and click the Thumbs Up or Thumbs Down icon to provide feedback on the generated content.
Command line explanation
In detections with associated process events, you can use the Taegis AI Command Line Explanation feature to translate complex command lines into easy-to-understand language.
In the Process Data section, click Explain Command Lines to generate the command line explanation.
JSON tab
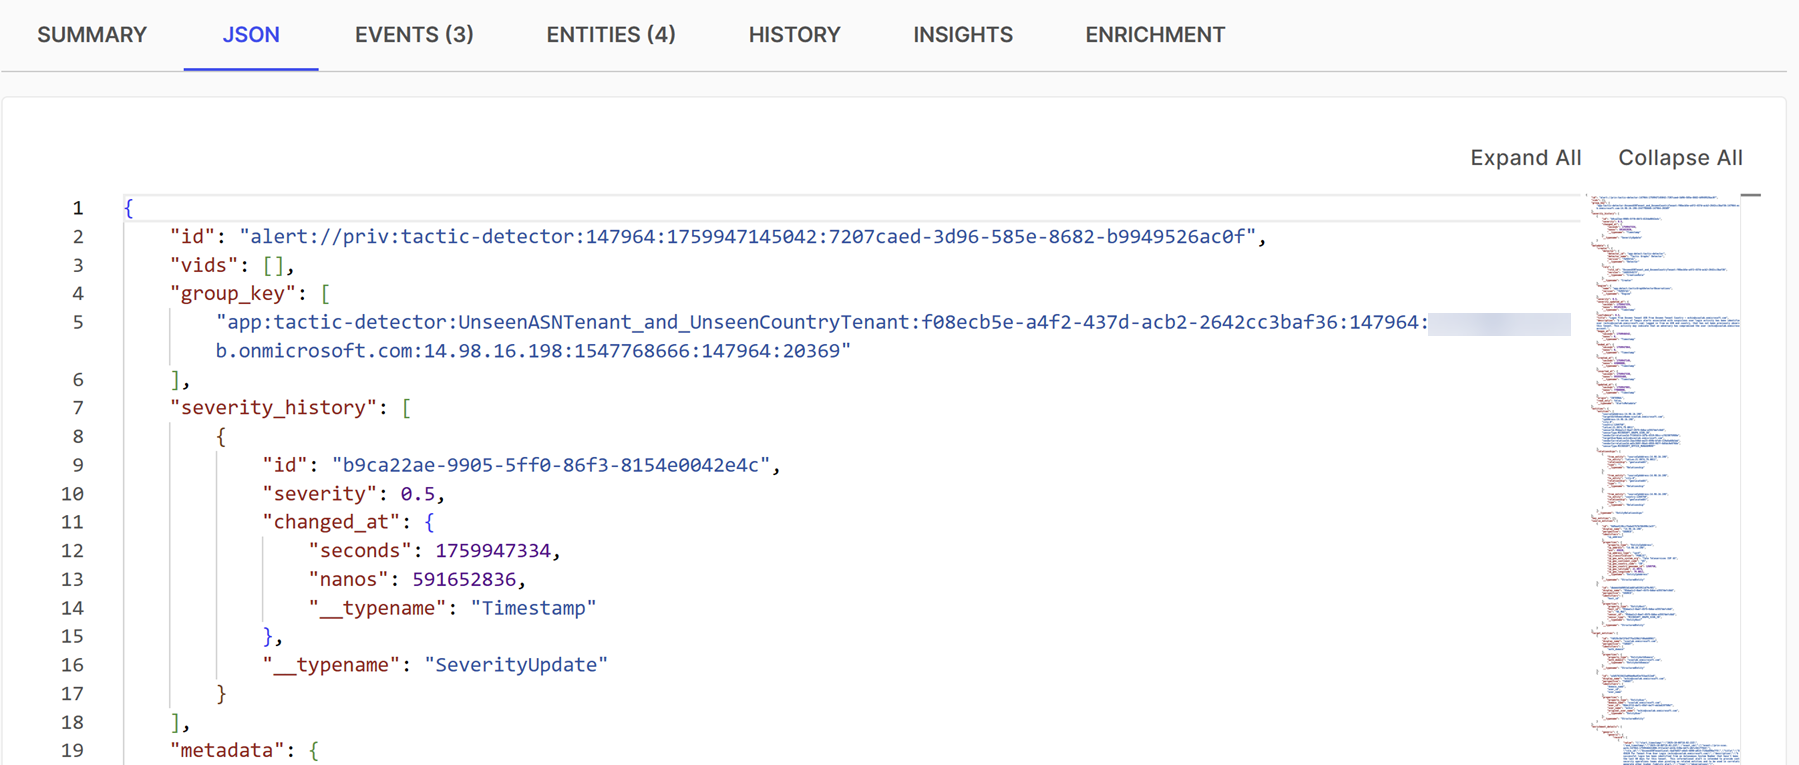
The JSON tab shows an expandable JSON view of the detection.
Events tab
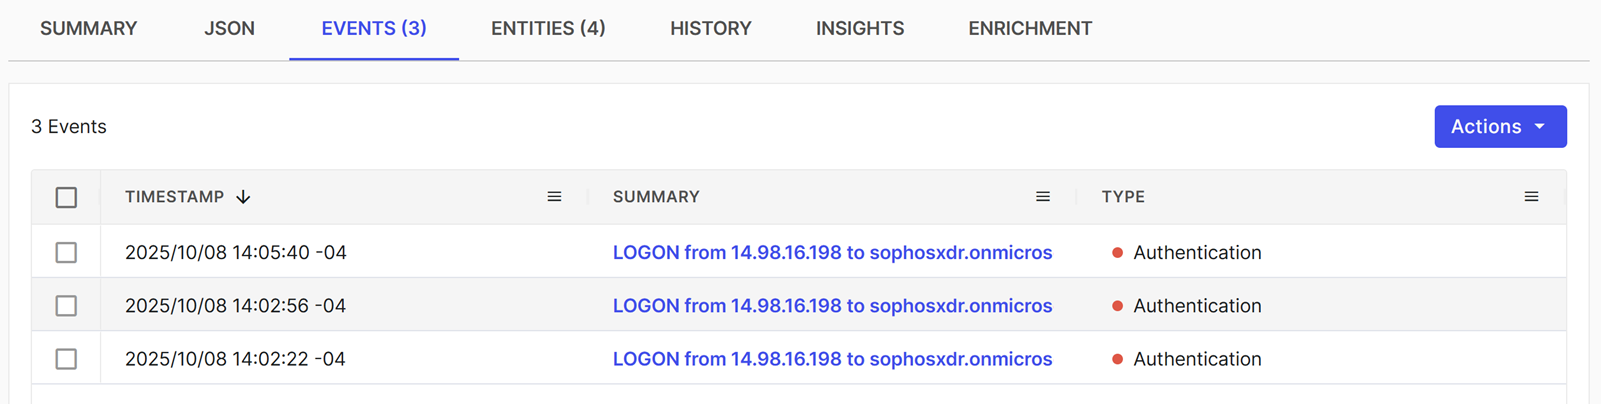
The Events tab shows a table of the events that resulted in the creation of the detection.
Take the following actions from this tab:
- Click an event summary in the table to see its details. For more information, see Events.
- To export the full table of events, click Actions > Export All as CSV.
- To export a subset of the table of events, select the checkboxes of those you want to export, then click Actions > Export Selected as CSV.
- To add events to a case, select the checkboxes of those you want to add, then click Actions and choose either Add to Existing Case or Create New Case. For details, see Create and add to cases.
Entities tab
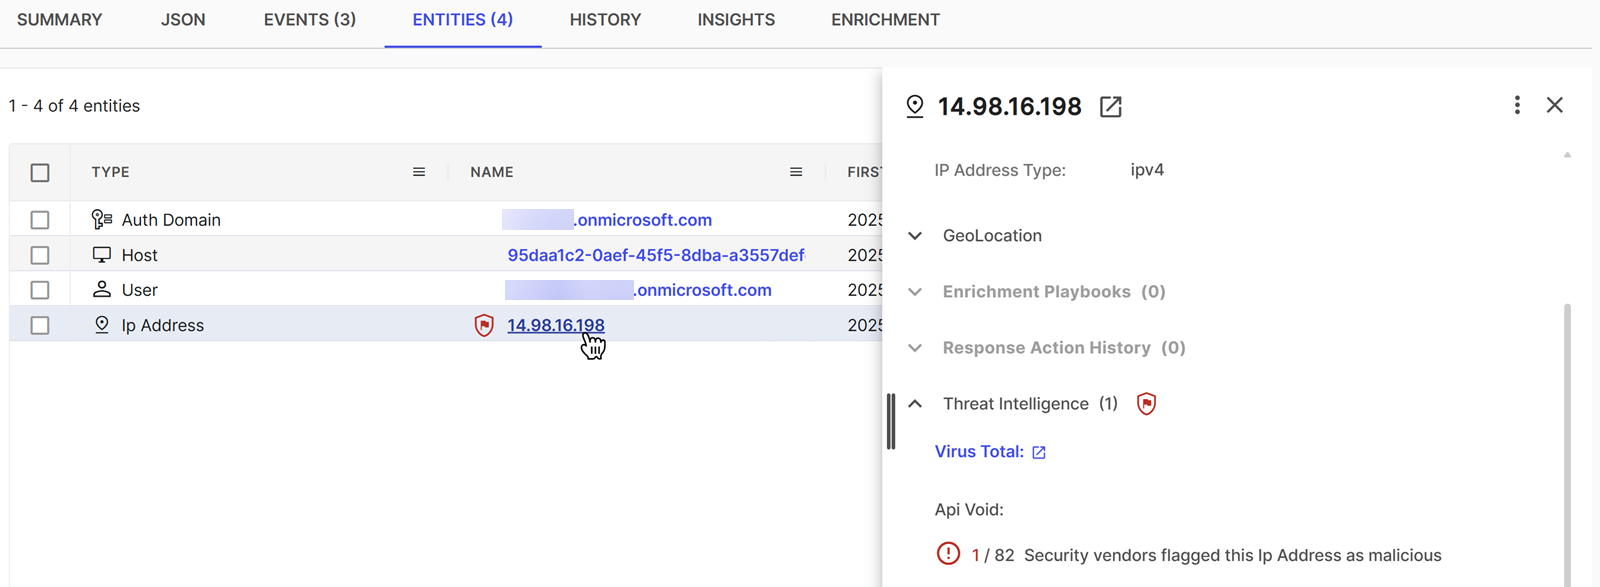
The Entities tab shows a table of the entities involved in the detection. The data includes the type of entity, the name with a Shield icon if threat intelligence enrichment is available, and the dates it was first and last seen.
Take the following actions from this tab:
- Click an entity name in the table to view its details. For details, see Entities.
- Click the three dots in the Actions column to view and perform configured response actions. For details, see Configuring actions.
Vulnerabilities tab
Info
The Vulnerabilities tab is only visible to Managed Risk customers, and Sophos XDR or MDR customers who have set up the Tenable integration. For more information, see Sophos Managed Risk and Tenable.
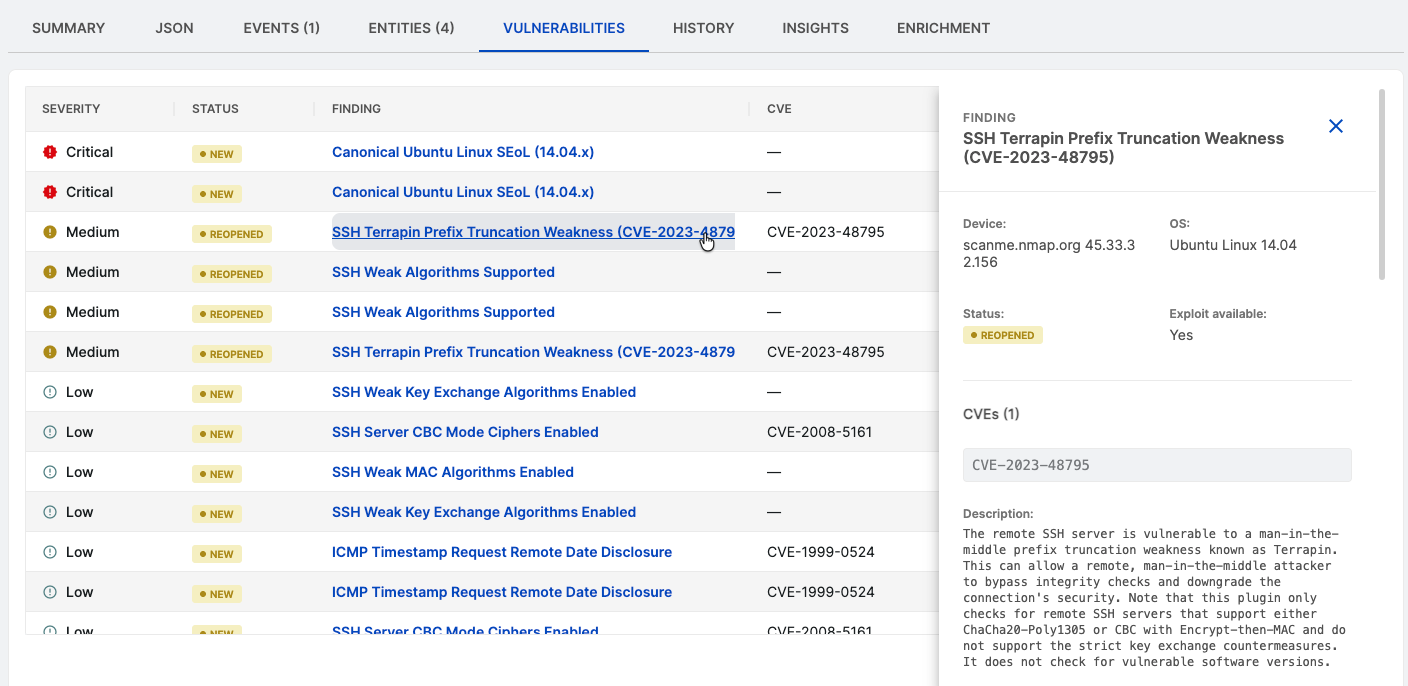
The Vulnerabilities tab shows details about vulnerabilities impacting any of the hosts associated with the detection. Click a vulnerability to view more information about each finding, such as affected asset details, plugin details, CVEs and CVSS scores, and port and protocol details.
History tab
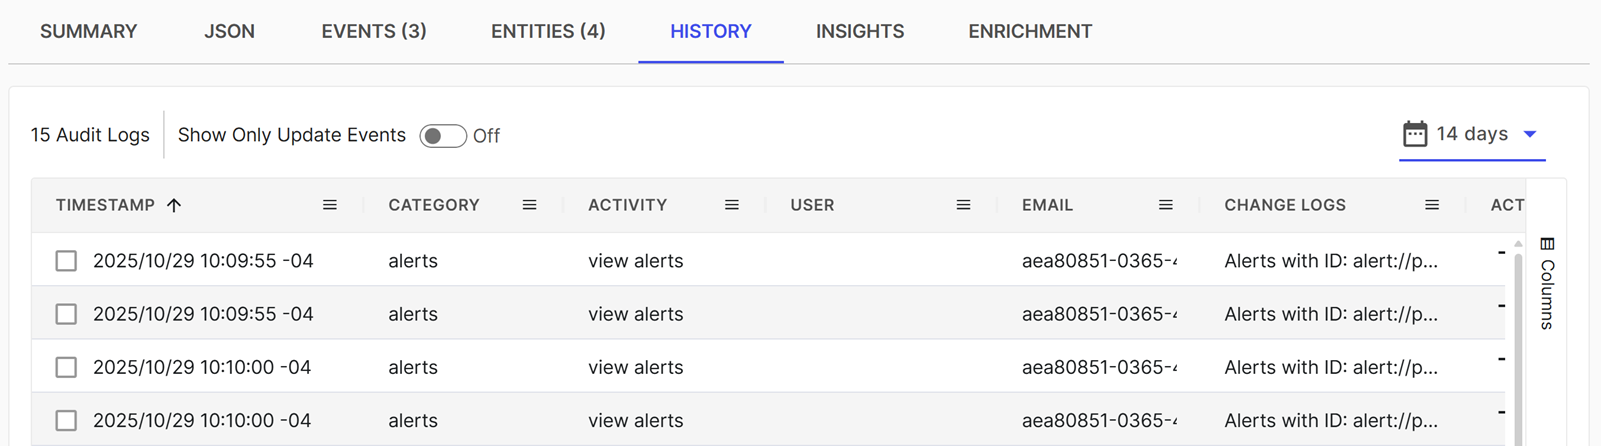
The History tab shows audit logs related to the detection. You can turn on the Show Only Update Events option to view only logs related to updates made to the detection or turn it off to view all logs.
Click View Diff in the Actions column when available to view the changes.
Insights tab
The Insights tab has multiple sections that add additional context to the detection.
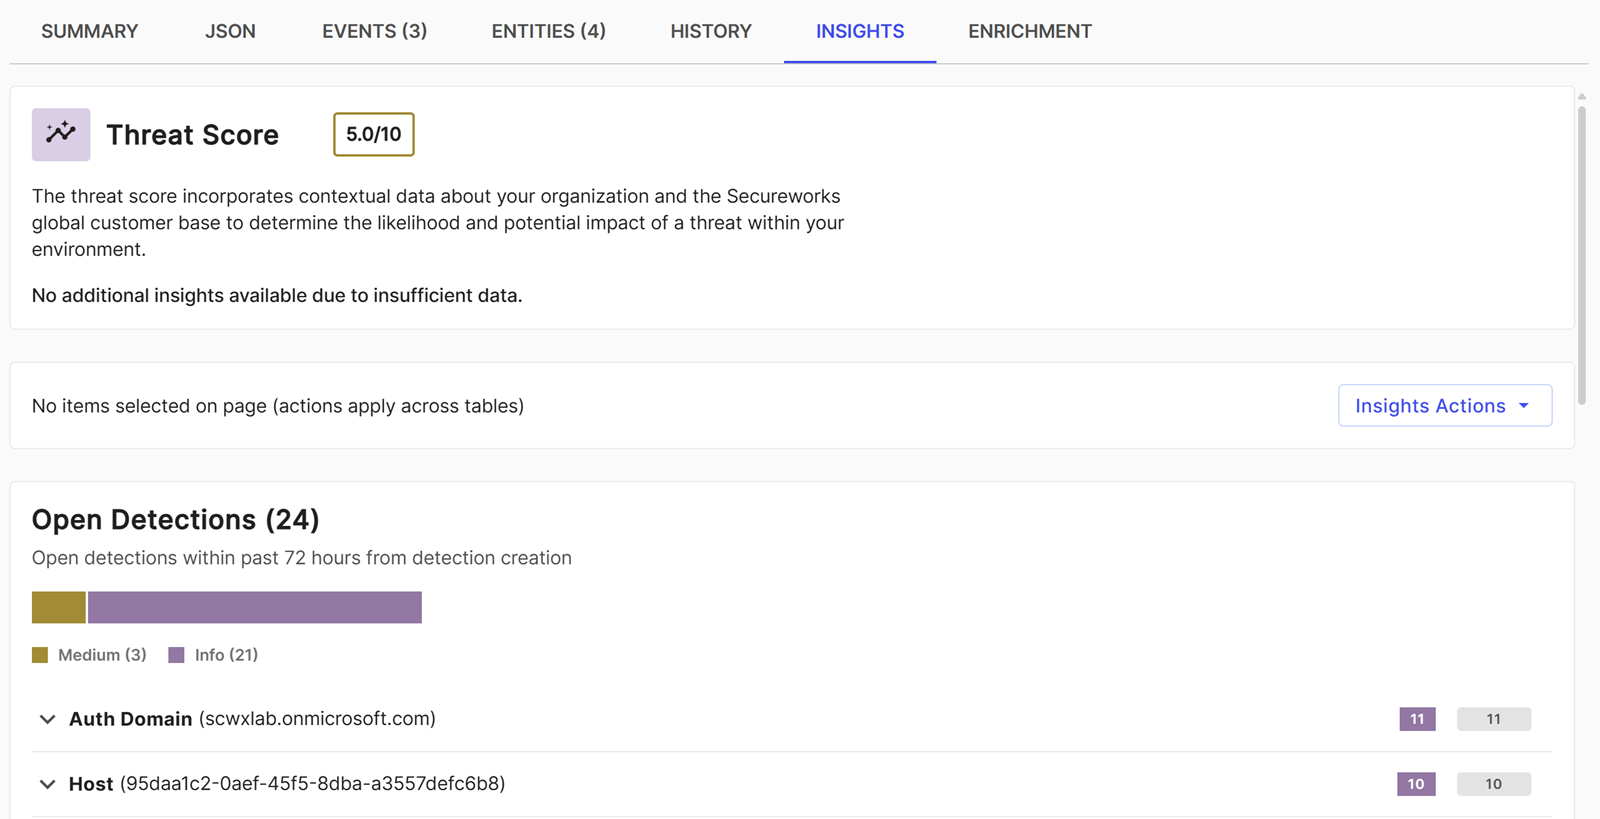
Threat Score
The Threat Score section shows the detection's Threat Score. For details, see Threat Score.
Detections
The Open Detections and Closed Detections sections list other detections that share factors with the current detection. Both sections are organized by the entity type shared in common with the detection, such as user, file, or hostname.
Cases
The Cases section lists open and closed cases that include entities related to the current detection, organized by entity type. This can help you determine if a case is already open for an entity during triage to avoid creating duplicate cases. Closed cases can add context to how cases were previously handled for an entity.
Enrichment tab
The Enrichment tab shows any enrichment automations that have executed on the detection. Click an entry to view the output of the automation and its execution history.
See threat intelligence
You can see threat intelligence information for detections in one of the following ways:
-
Shield Icon: Click the Shield icon in the Affected Entities section of detections to see threat intelligence.
-
Entities Tab: Go to the Entities tab and select an entity marked with a Shield icon to see its threat intelligence information.
For more information, see Detection enrichment.
Explore a detection in detail with Entity Graph
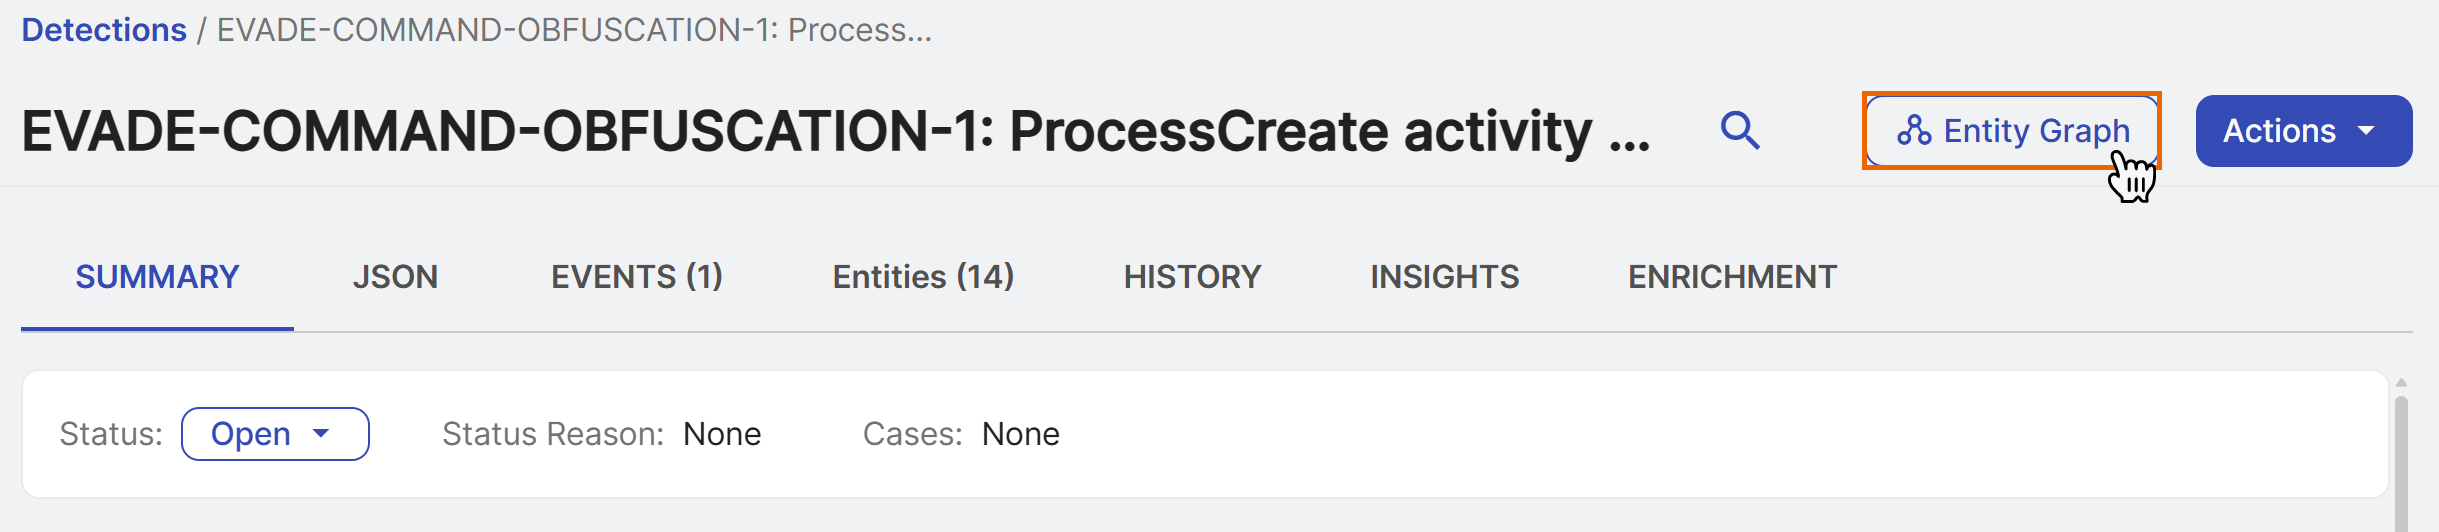
To deep dive into the detection's associated entities and explore their relationships and details, click Entity Graph at the top of detection details. For details, see Entity Graph.
Actions
When viewing detection details, click Actions to perform the following actions on the detections:
- Add to Existing Case: Add the detection to an existing case. See Create and add to cases.
- Create New Case: Create a new case with the detection. See Create and add to cases.
- Create Suppression Rule: Create a suppression rule to suppress future instances of the detection. See Detection suppression rules.
- Response Actions: Perform response actions if you have relevant automation actions configured. See Configuring actions.