Event Lineage and Process Tree
This page explains how to investigate process activity using the Lineage and Process Tree views. These visualizations help you understand process relationships. You can follow parent-child process chains, identify related detections and activities, and investigate associated events.
Use the Lineage view for flexible exploration of process ancestry and descendants across time, or use the Process Tree view for a simplified top-down representation of a process and its related activity.
Lineage view
The Lineage tab in process and detection finding events shows a visual, interactive view of the process lineage. Use this view when you need to explore parent and child processes across time.
This view also allows you to view detections, related events, and key activities.
View a lineage
To see an event's threat lineage, do as follows:
-
Open a process or detection finding event details page. Events are visible in search results, cases, and detection details pages. For information about event types, see Events.
How to find process and detection finding events
Search for process and detection finding events in Data Lake Search with the following queries:
FROM processandFROM detectionfinding. -
In the event details, click the Lineage tab.
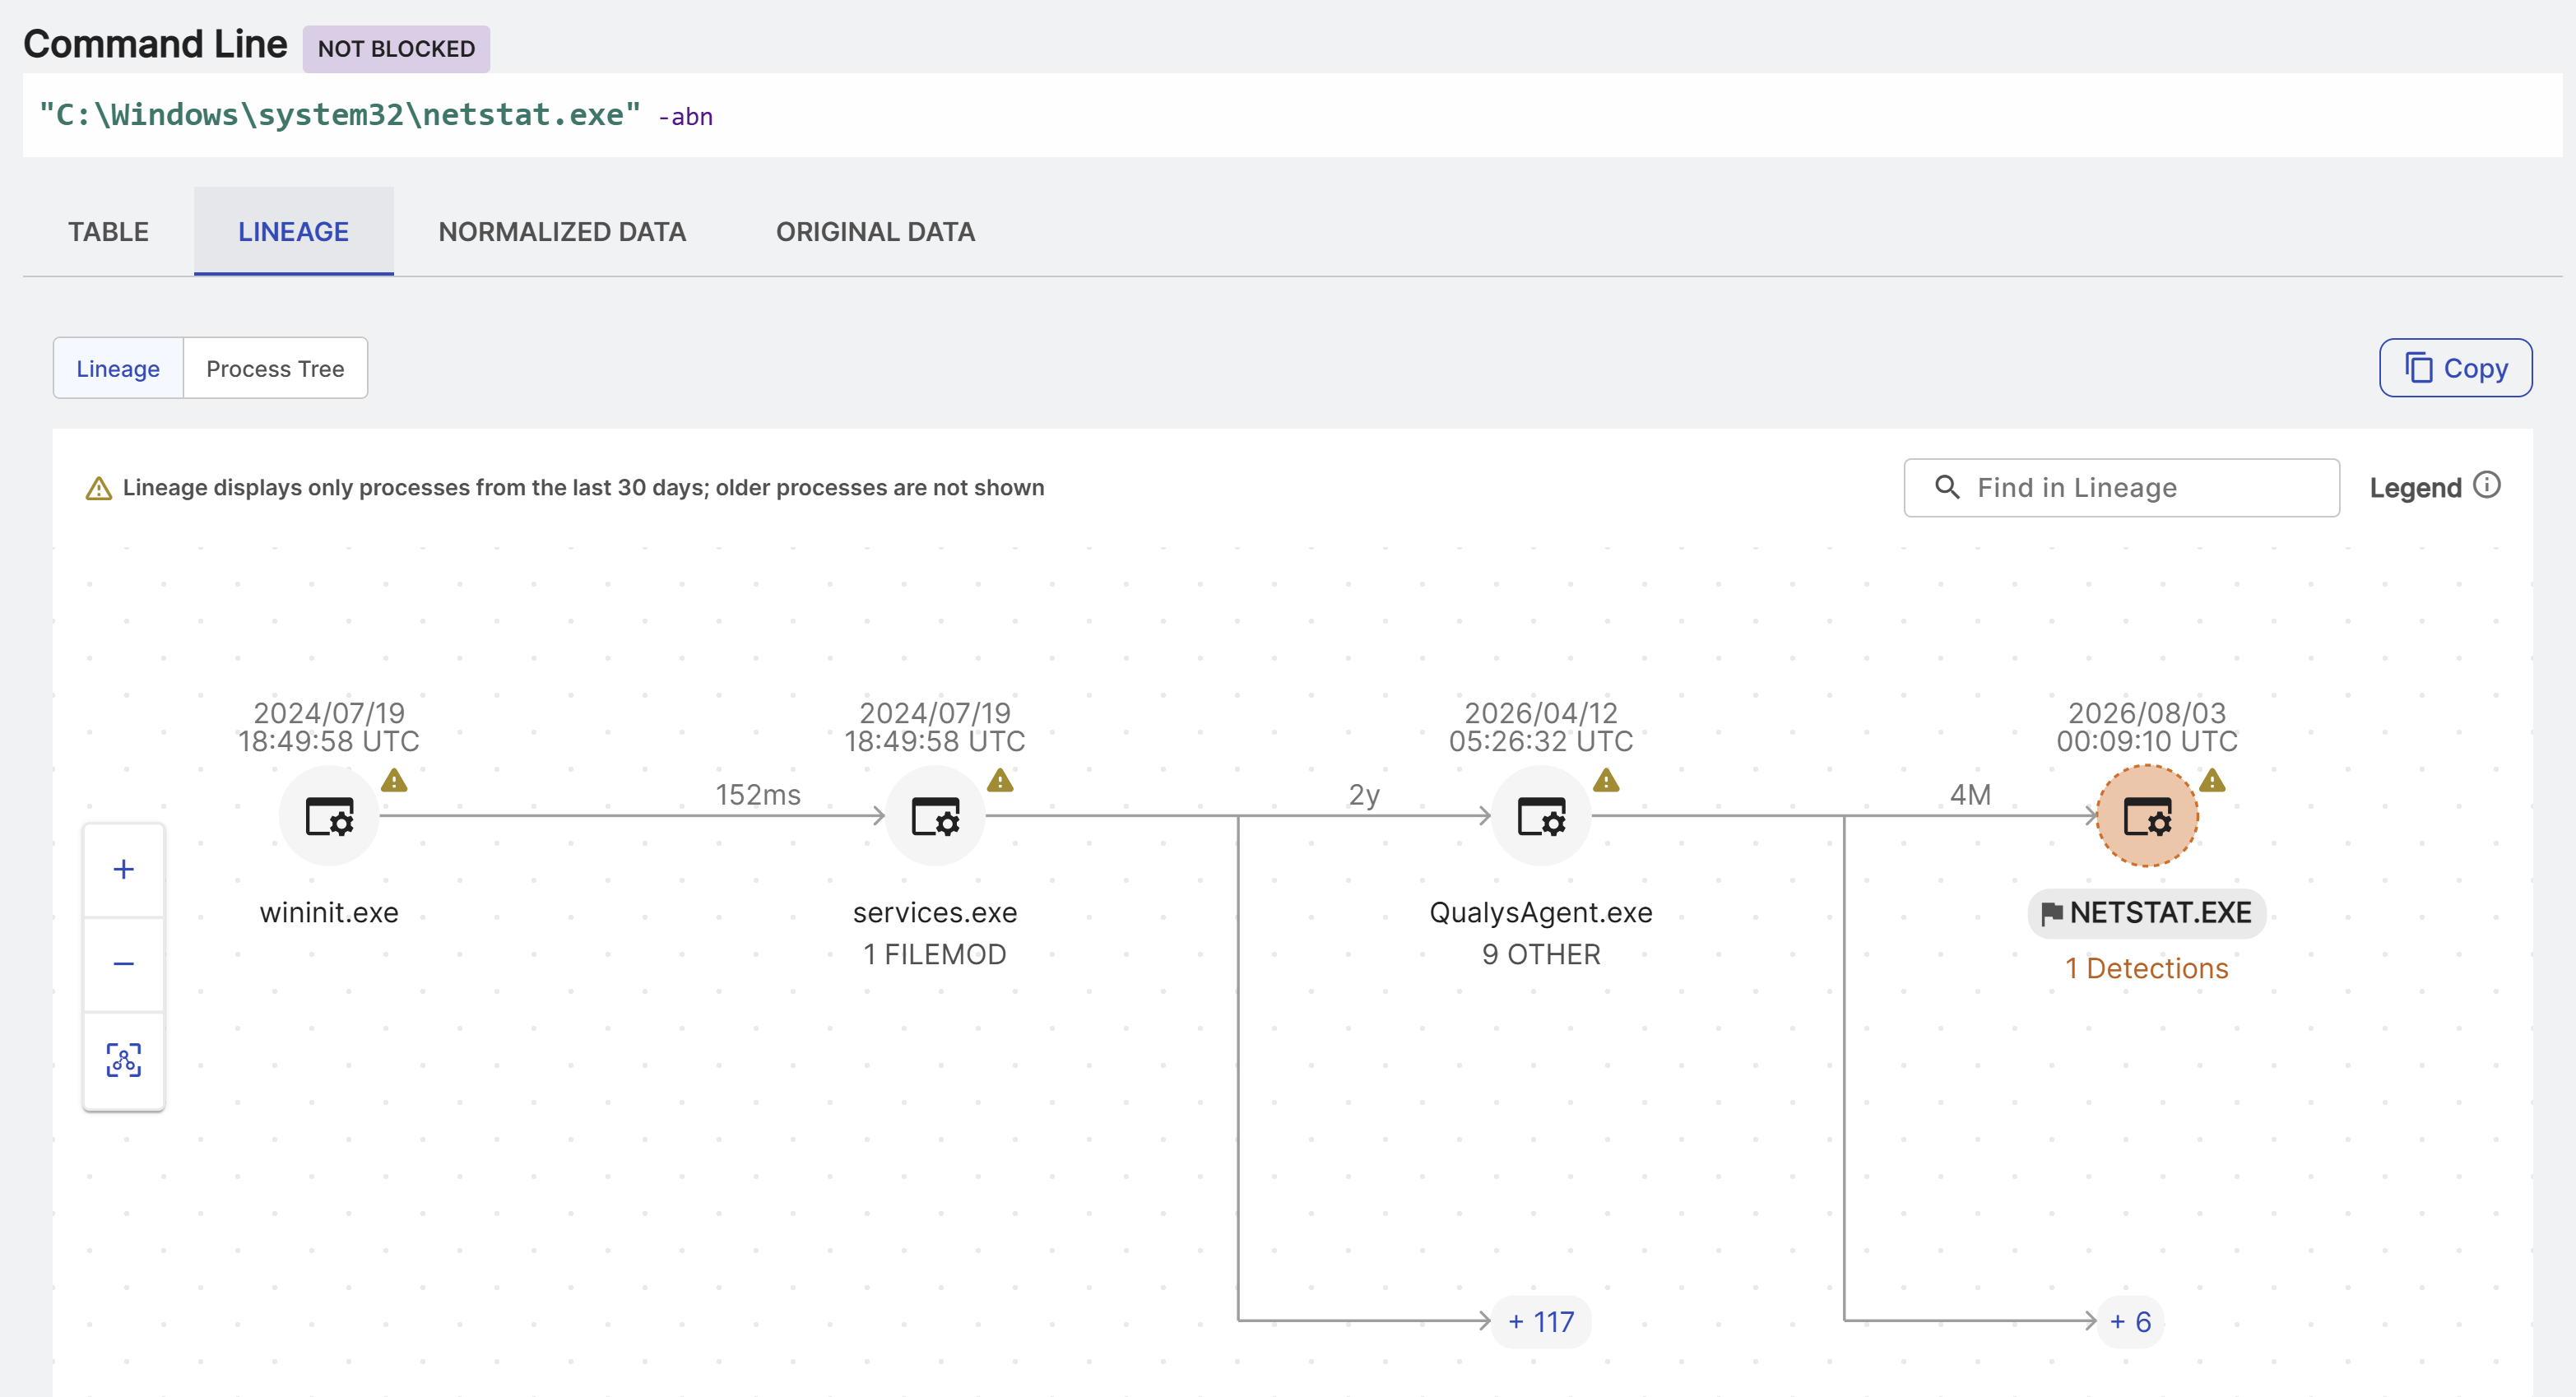
- A graph displays the process you're viewing with any ancestry and child processes.
Note
Lineage displays only processes from the last 30 days; older processes aren't shown. If the source process event itself is more than 30 days old, the Lineage tab is disabled.
Explore a lineage
The lineage graph may display the following information, depending on the event:
- Process creation date and time above the node
- Process name below the node
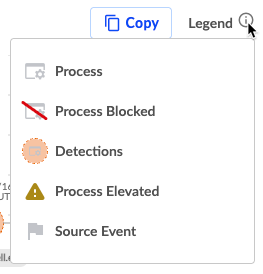
- Warning icon indicating a process is elevated
- Flag icon indicating a process is the source event
- Orange highlighted node indicating detections are associated with the process
- A red line through a blocked process node
- Number of detections, key activities, or related events below the associated process node
- The number of hidden child processes of a process
- The time difference between two processes above the connecting line
Tip
Click the Legend tooltip at the top right of the graph to see the list of icons that may appear in the graph and their meanings.
See more details of a process
See more details of a process in the following ways:
-
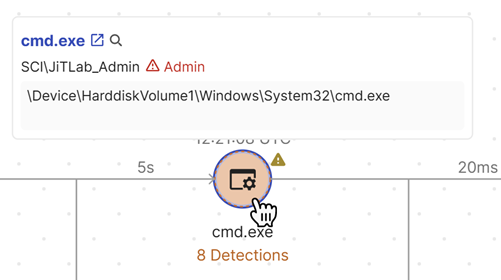
Hover over a process node to show basic details, the full image path, username with annotation if the user is an admin, and a link to open the event details in a new tab.
-
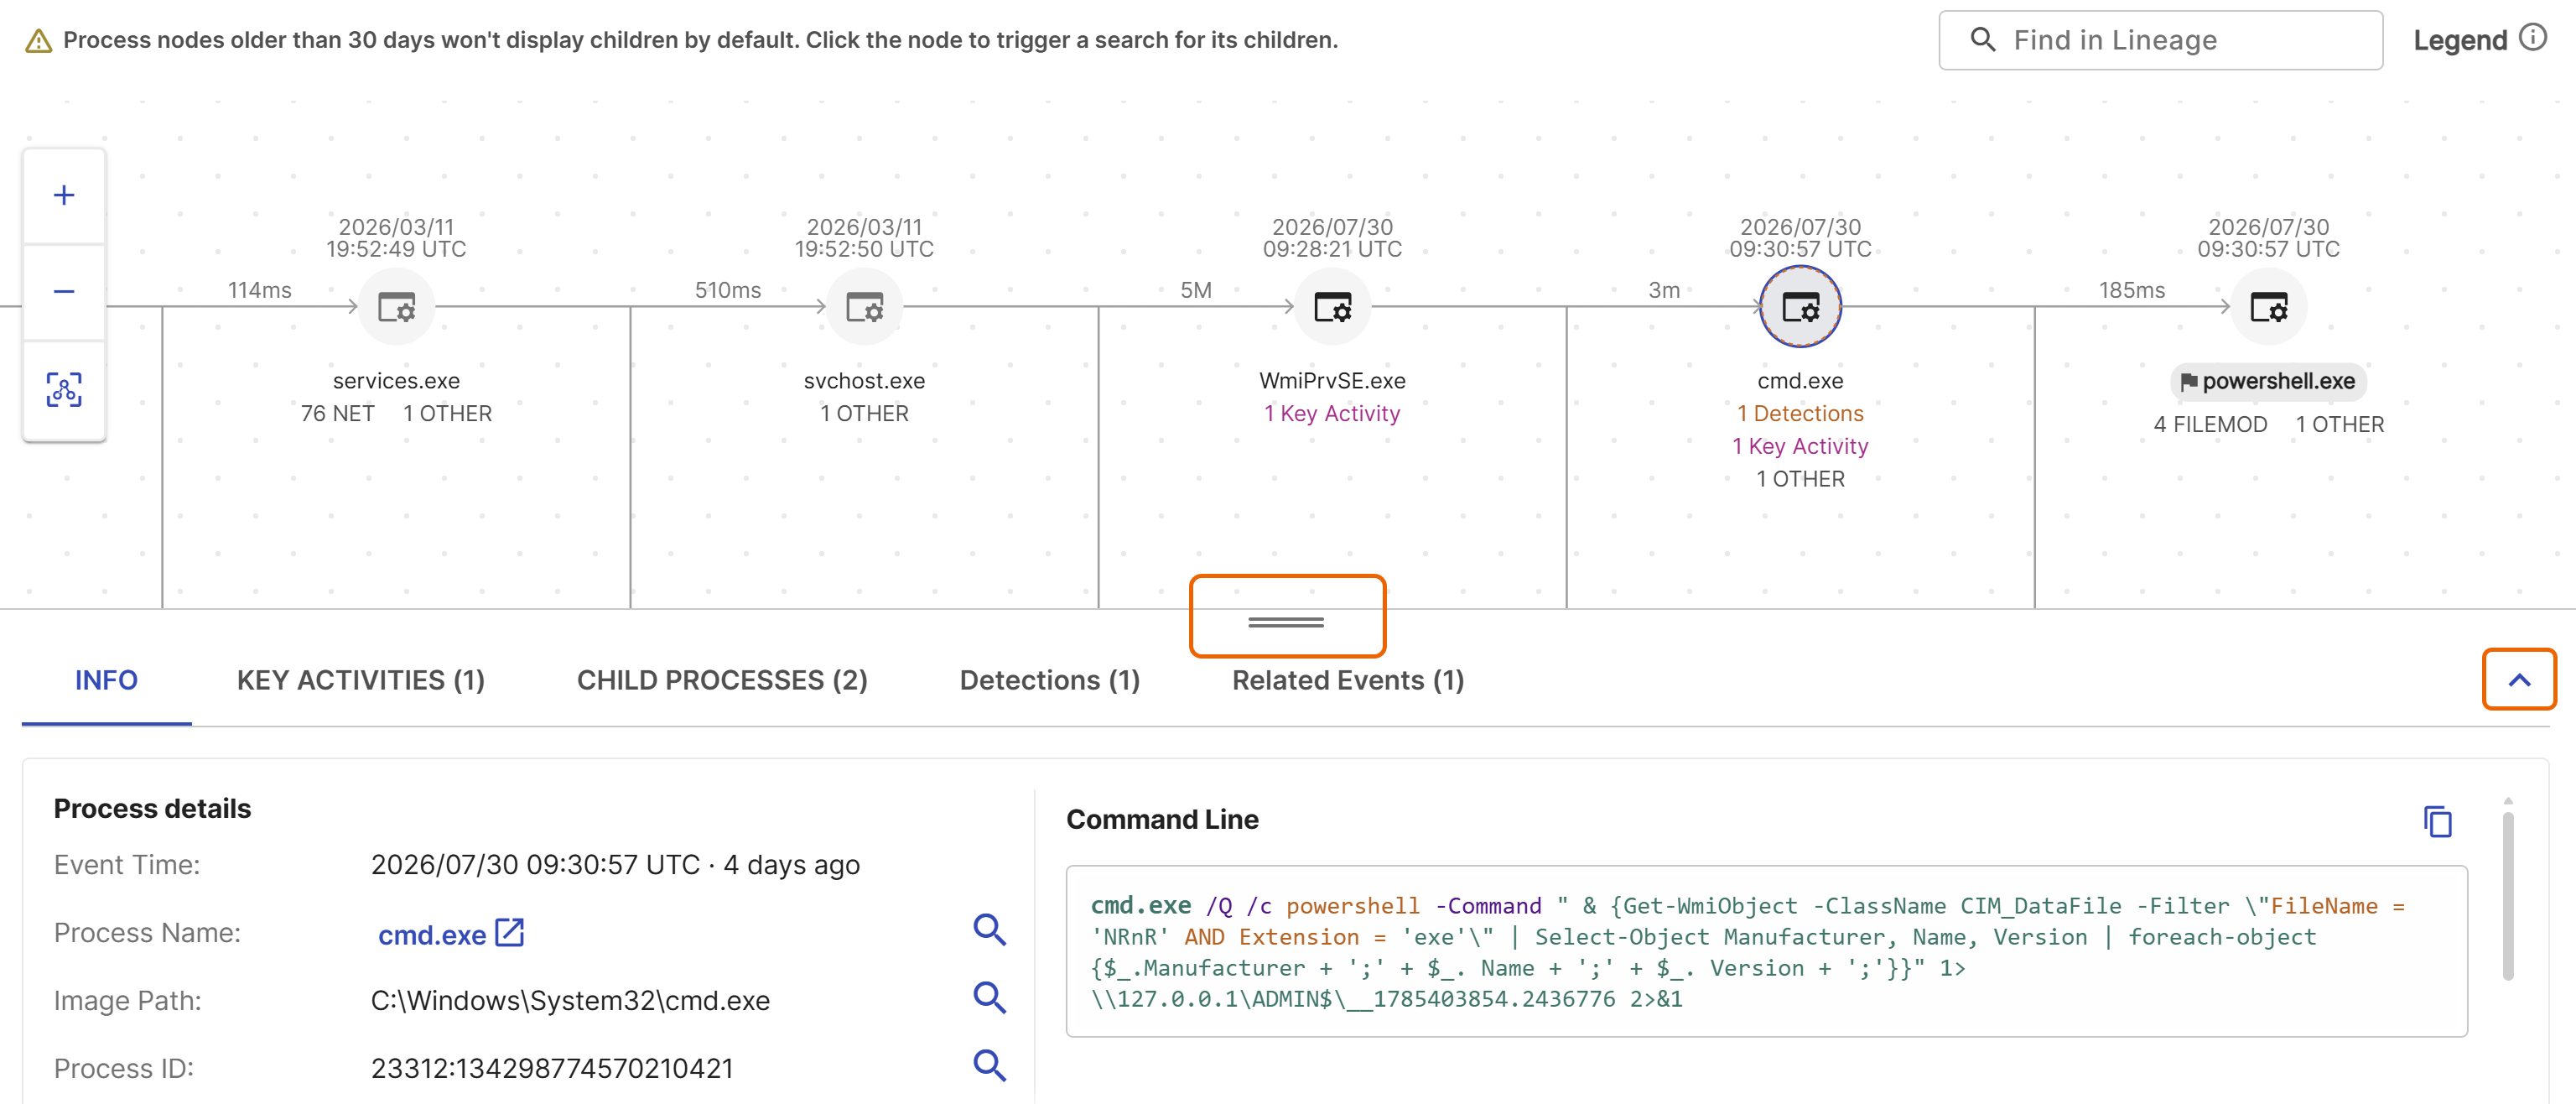
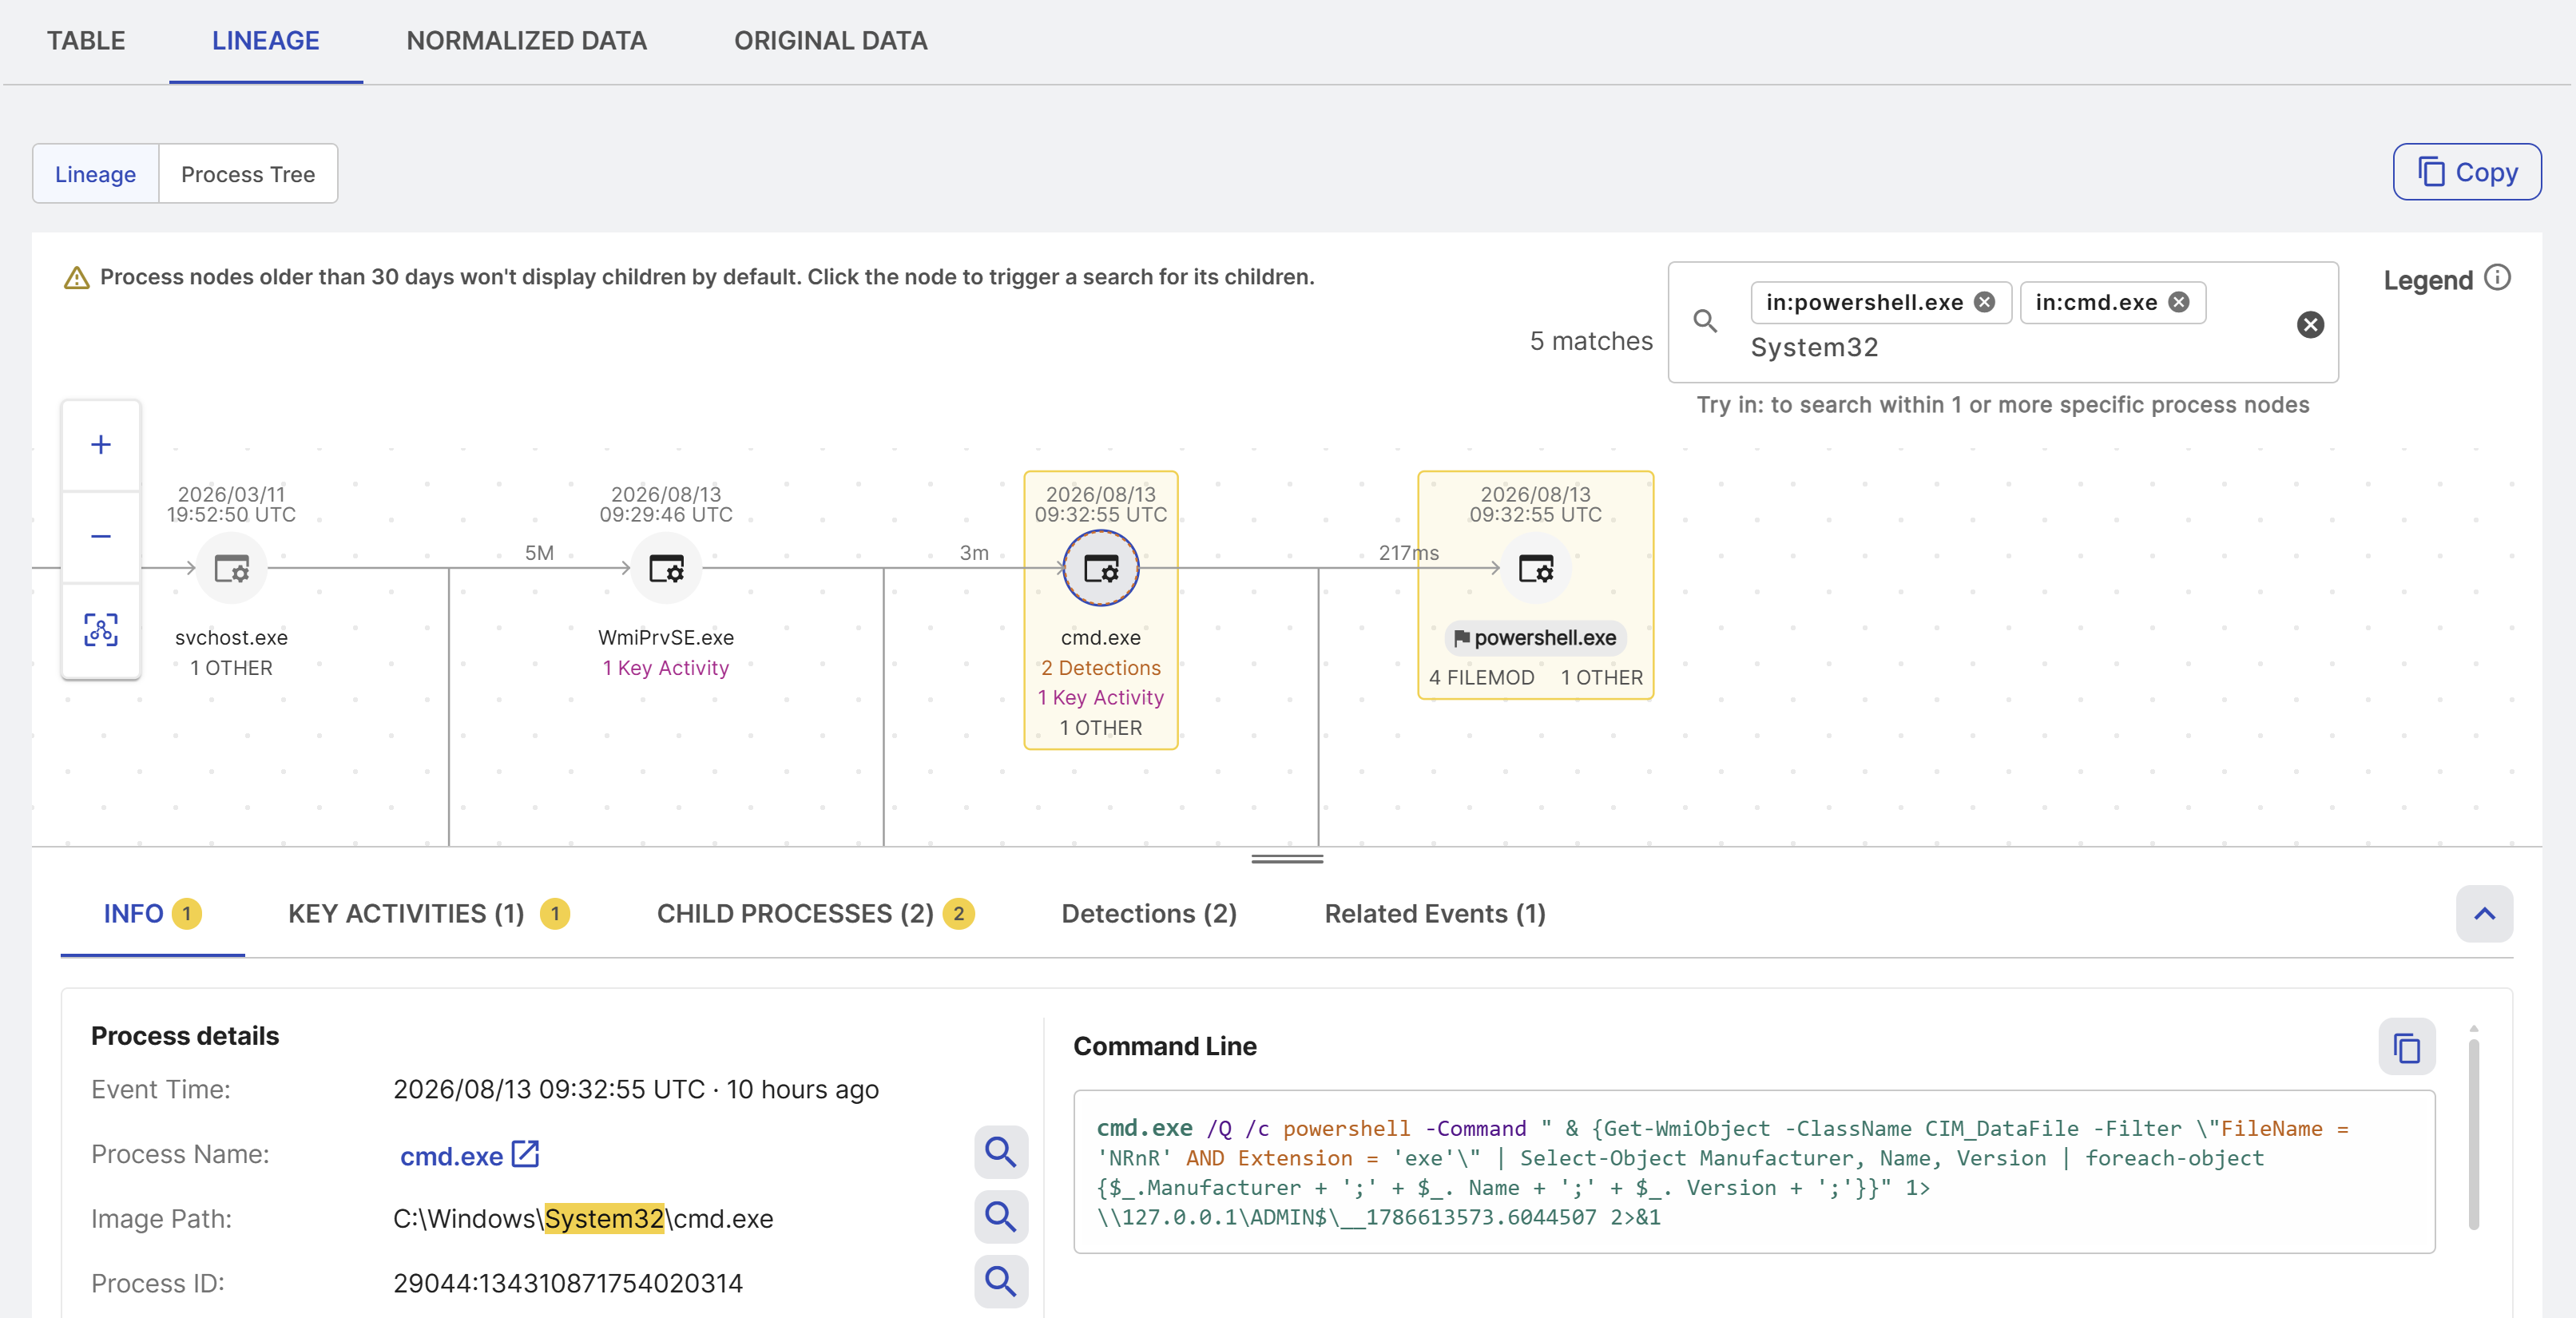
Click a process node in the graph to open the Info tab below the graph.
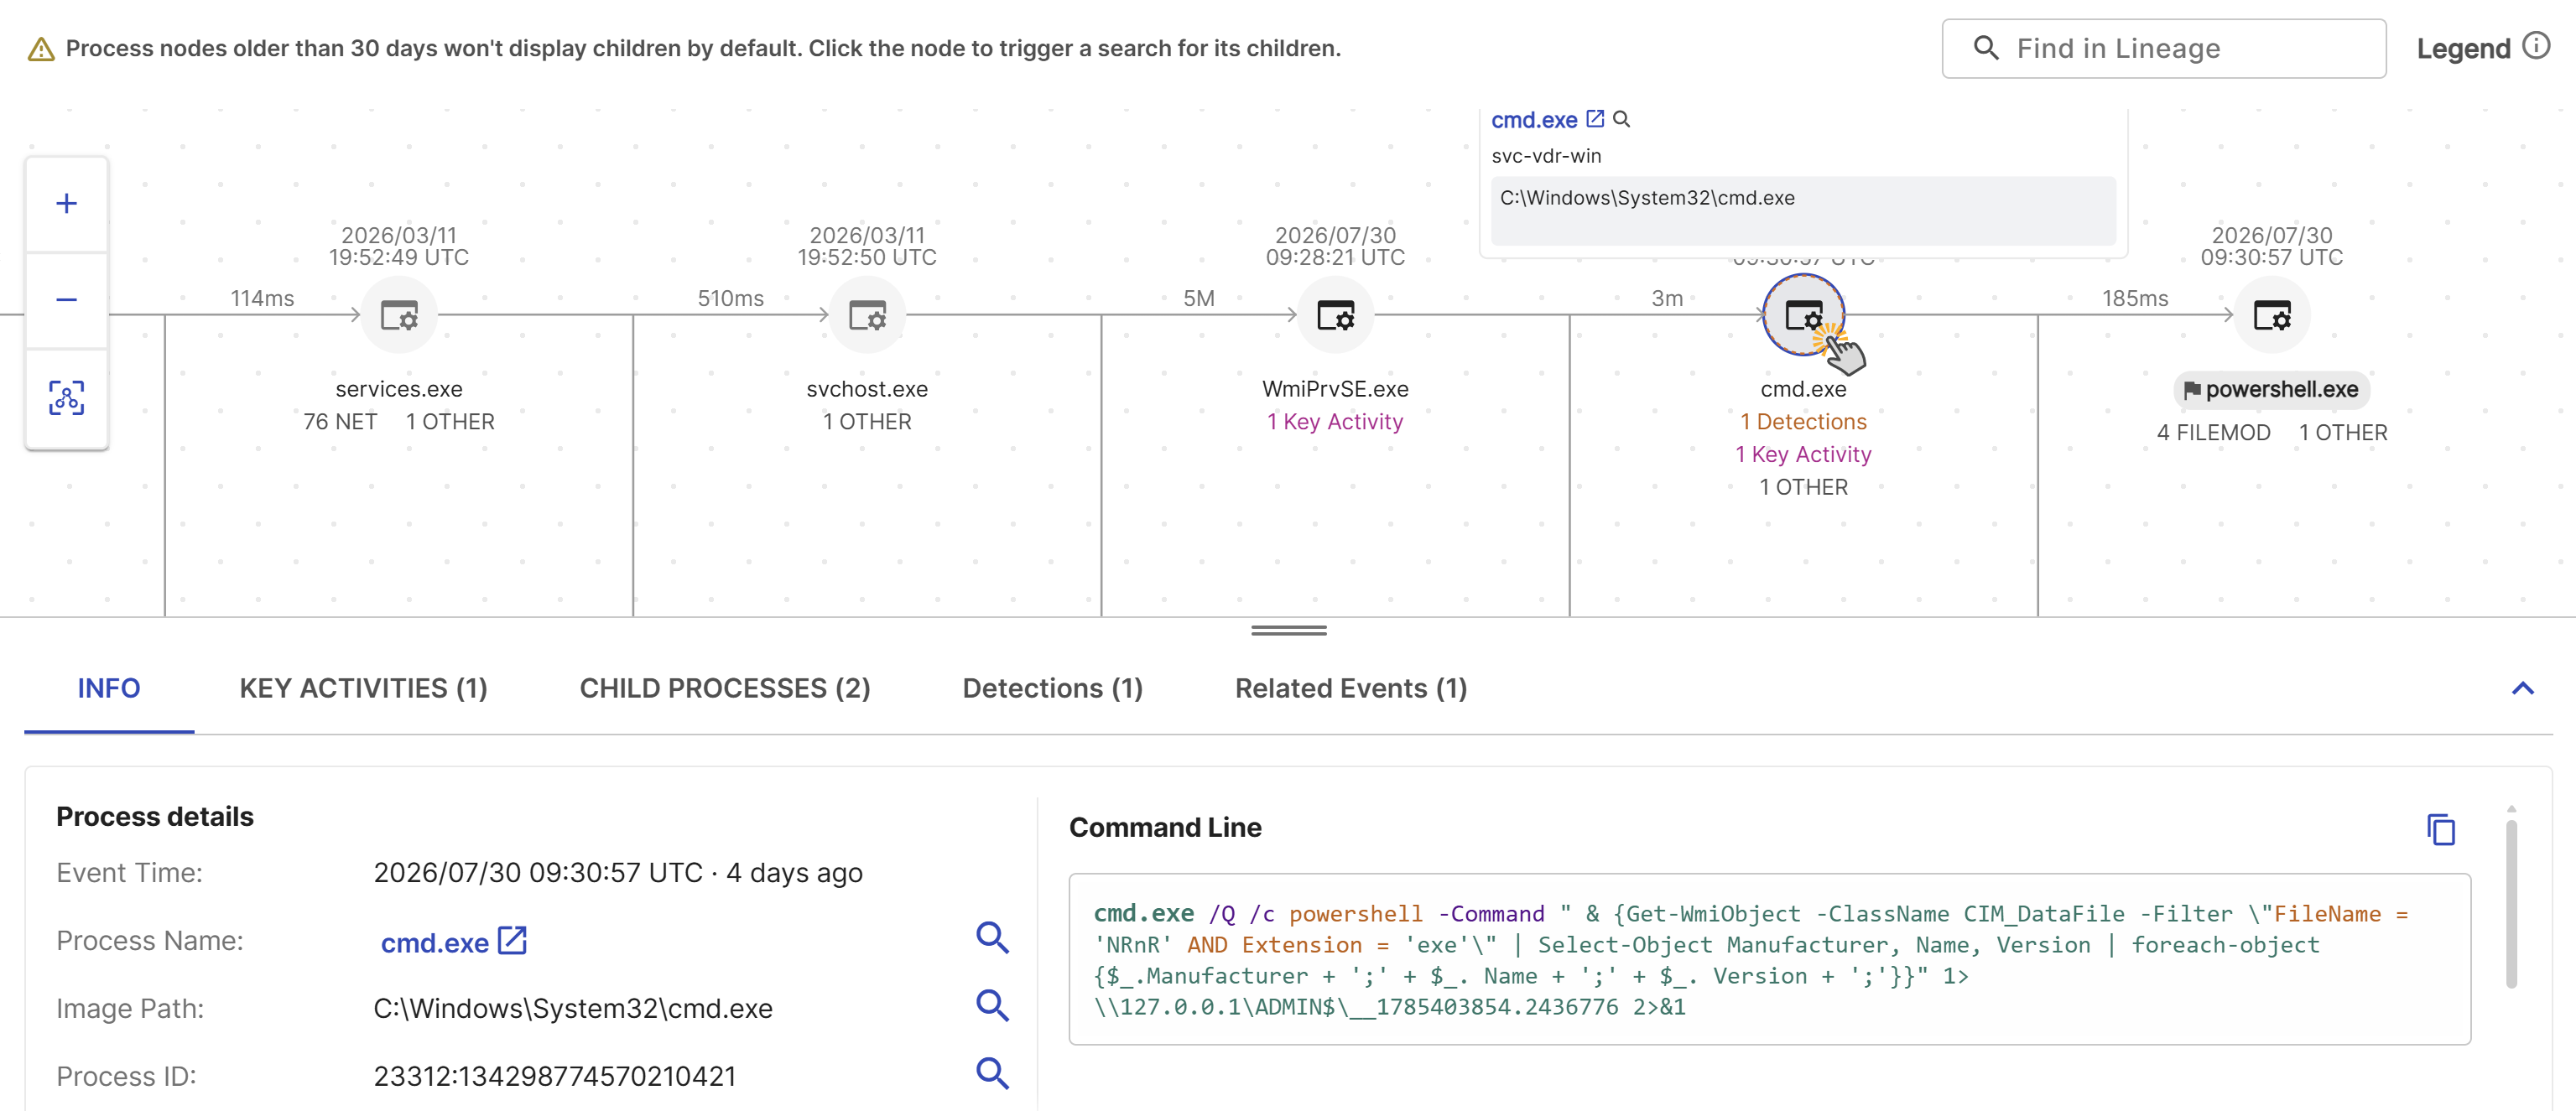
The Info tab shows process details and the command line. Take the following actions from the Info tab:
- Click the process name to open the event details in a new tab.
- Click the icon next to a field to perform a pivot search based on that field. For more information, see Pivot search.
Tip
There’s a divider with a handle between the lineage graph and the tabbed section. Click and drag to resize the view. You can also click the arrow at the top right of the table to collapse the tabbed section view.
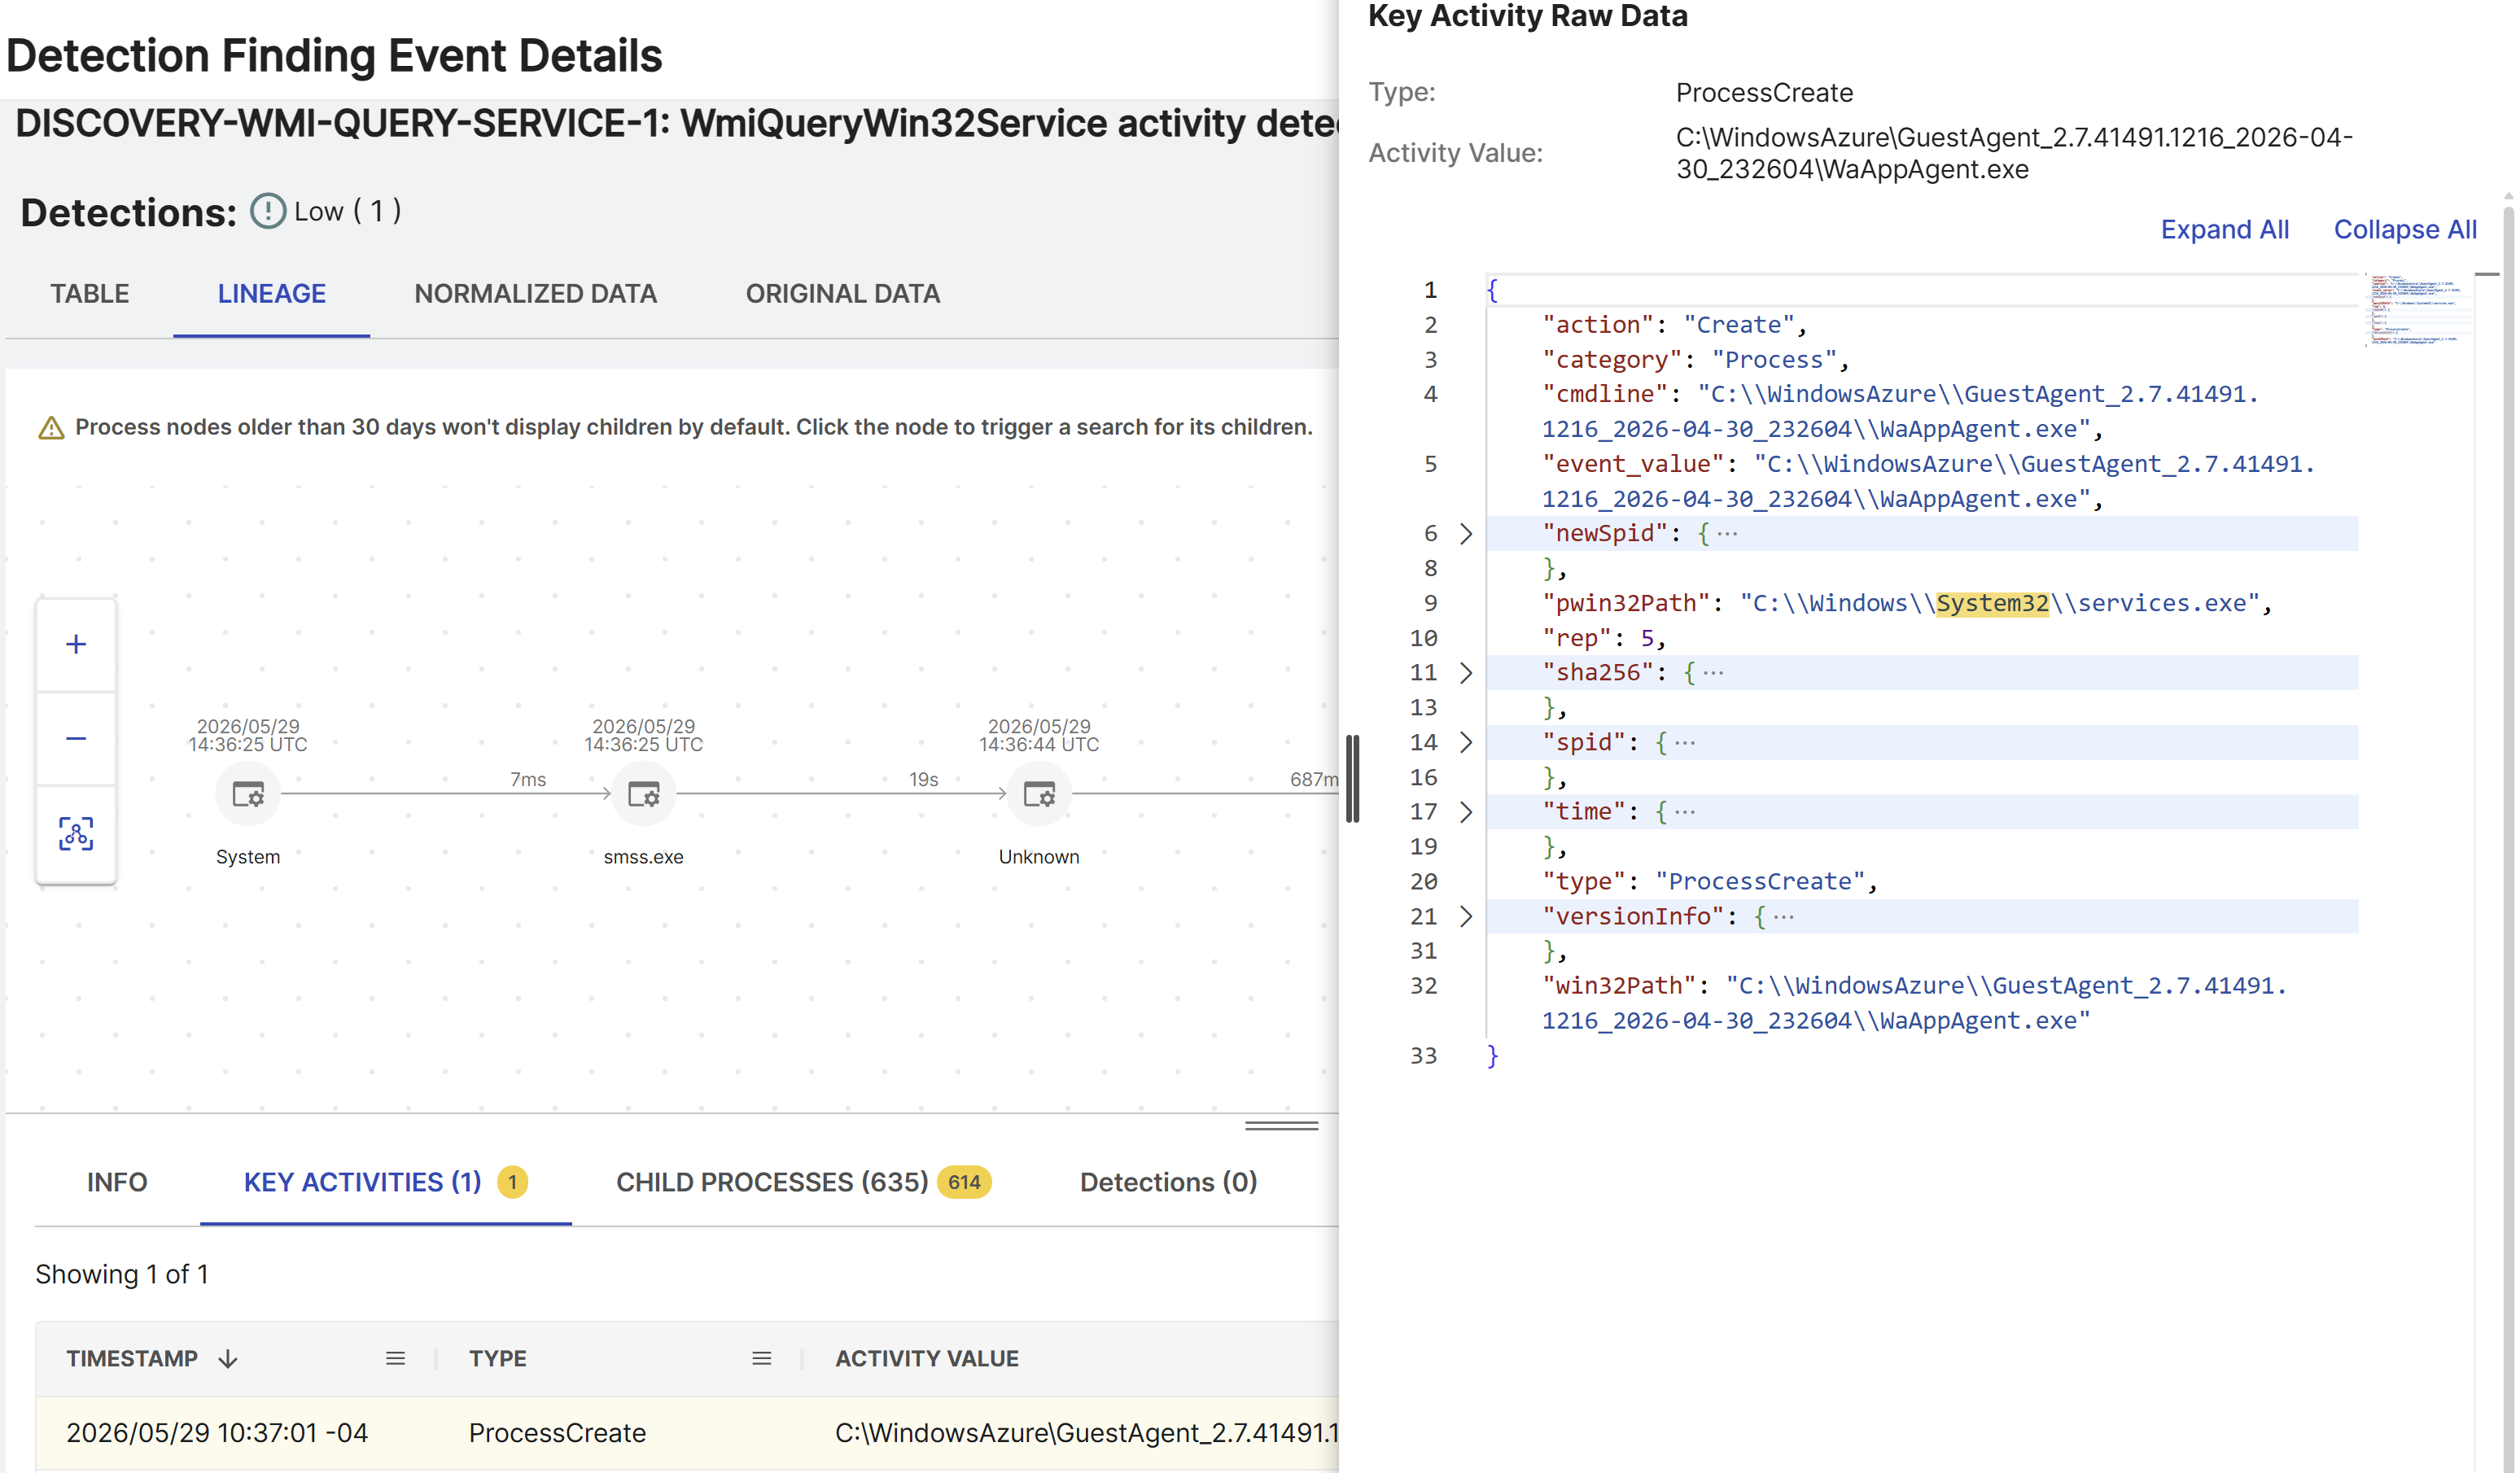
See key activities
The Key Activities tab below the graph shows any key activities associated with the selected process node that were generated by Sophos Endpoint Agents.
Note
The Key Activities tab only shows if you have Sophos Agents in your environment.
View the Key Activities tab in two ways:
- Click a Key Activities link below a process node in the graph.
- Alternatively, click a process node in the graph and then select the Key Activities tab.
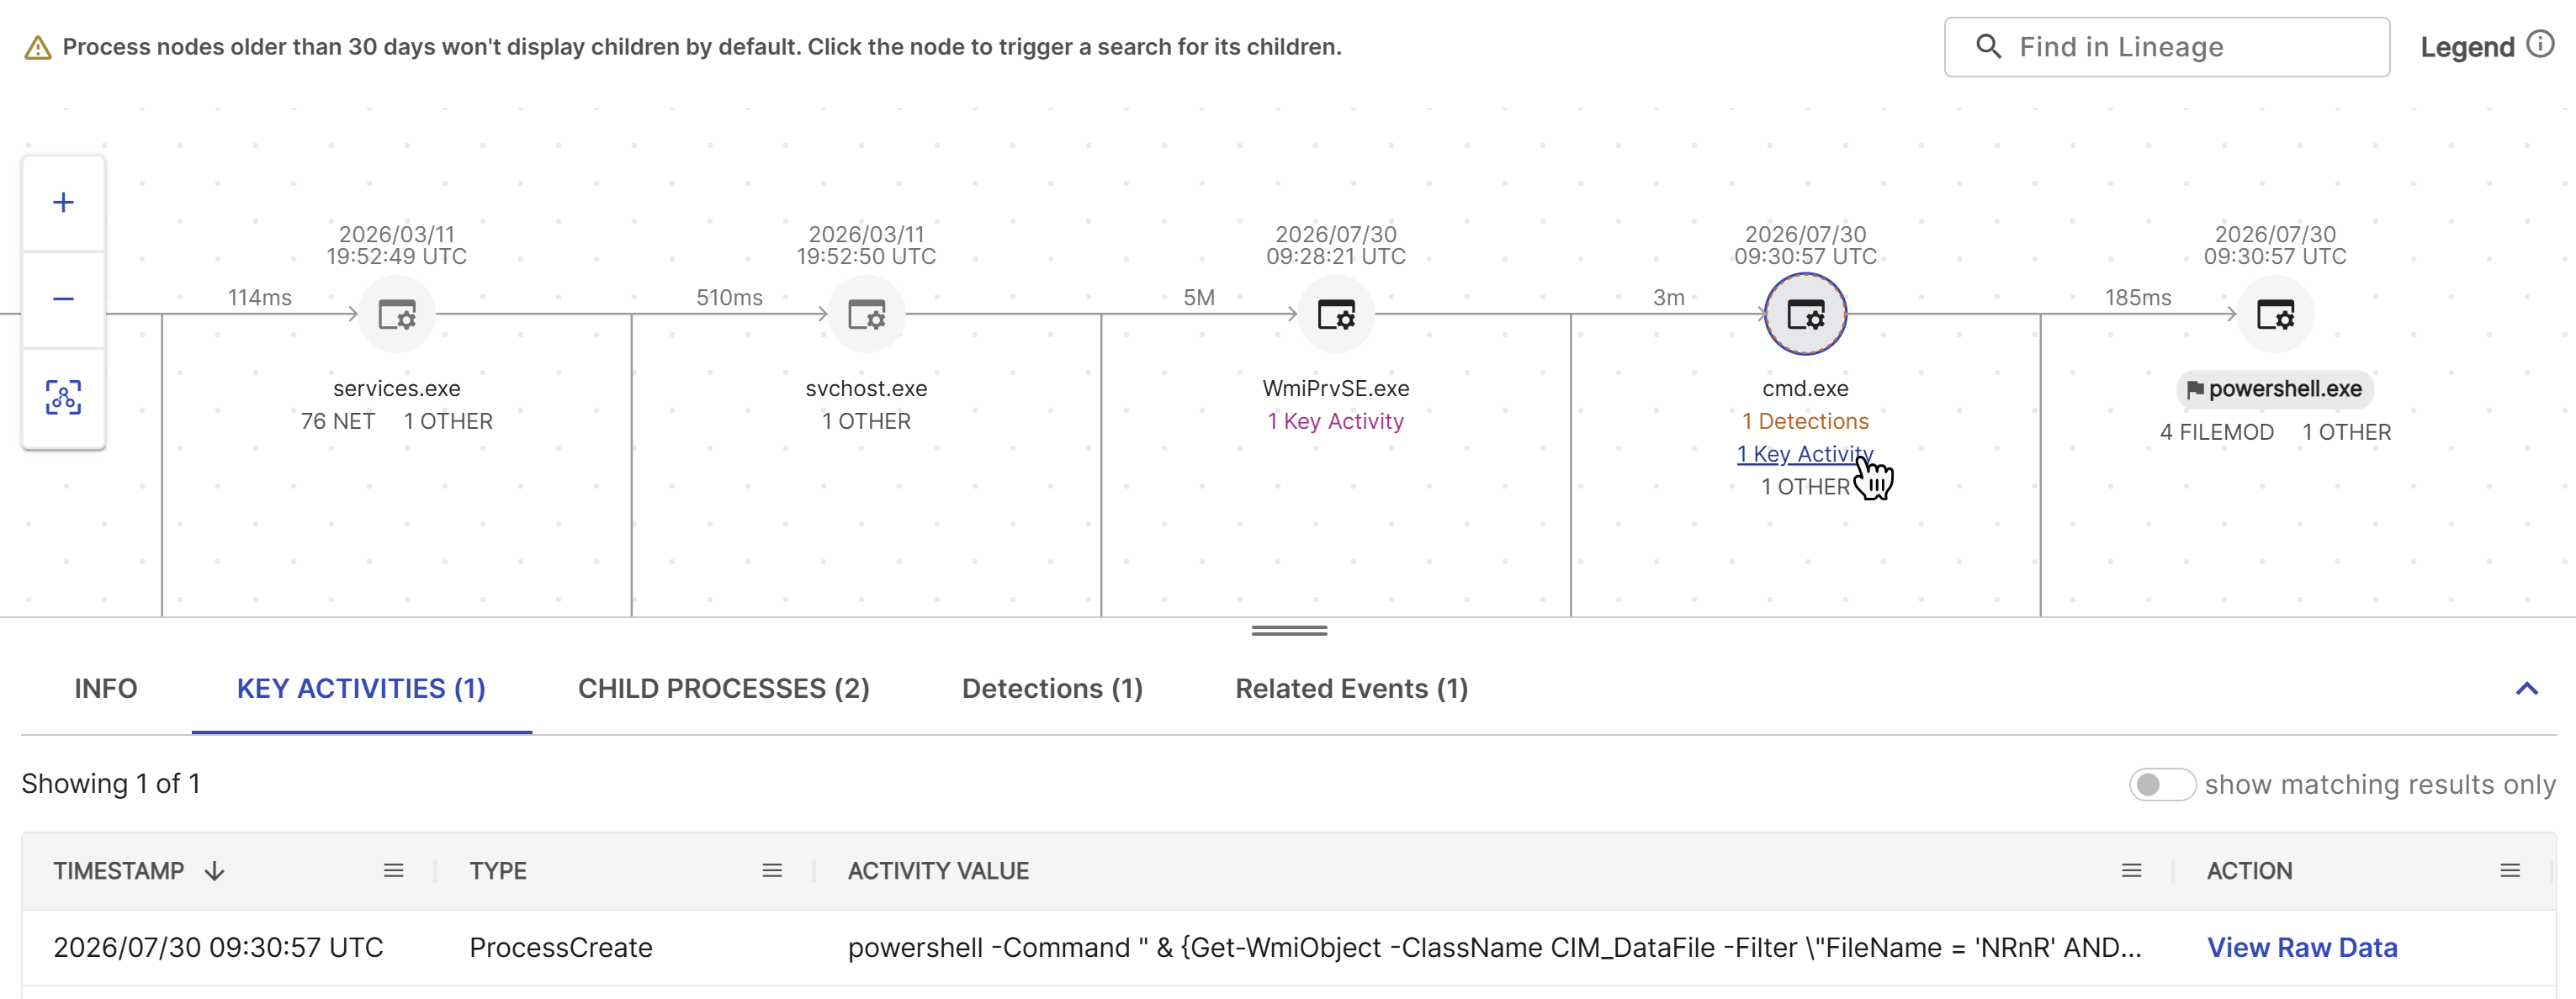
Key activities are surfaced from Sophos Agents, which capture endpoint events that have security value. These are snapshots of processes performing actions that could be indicators of compromise, are potentially suspicious, and are highlighted in the lineage.
Key activities comprise the following:
- Event type: The event as surfaced by the underlying detection event triggered on the endpoint.
- Activity value: Key data surfaced from the event.
-
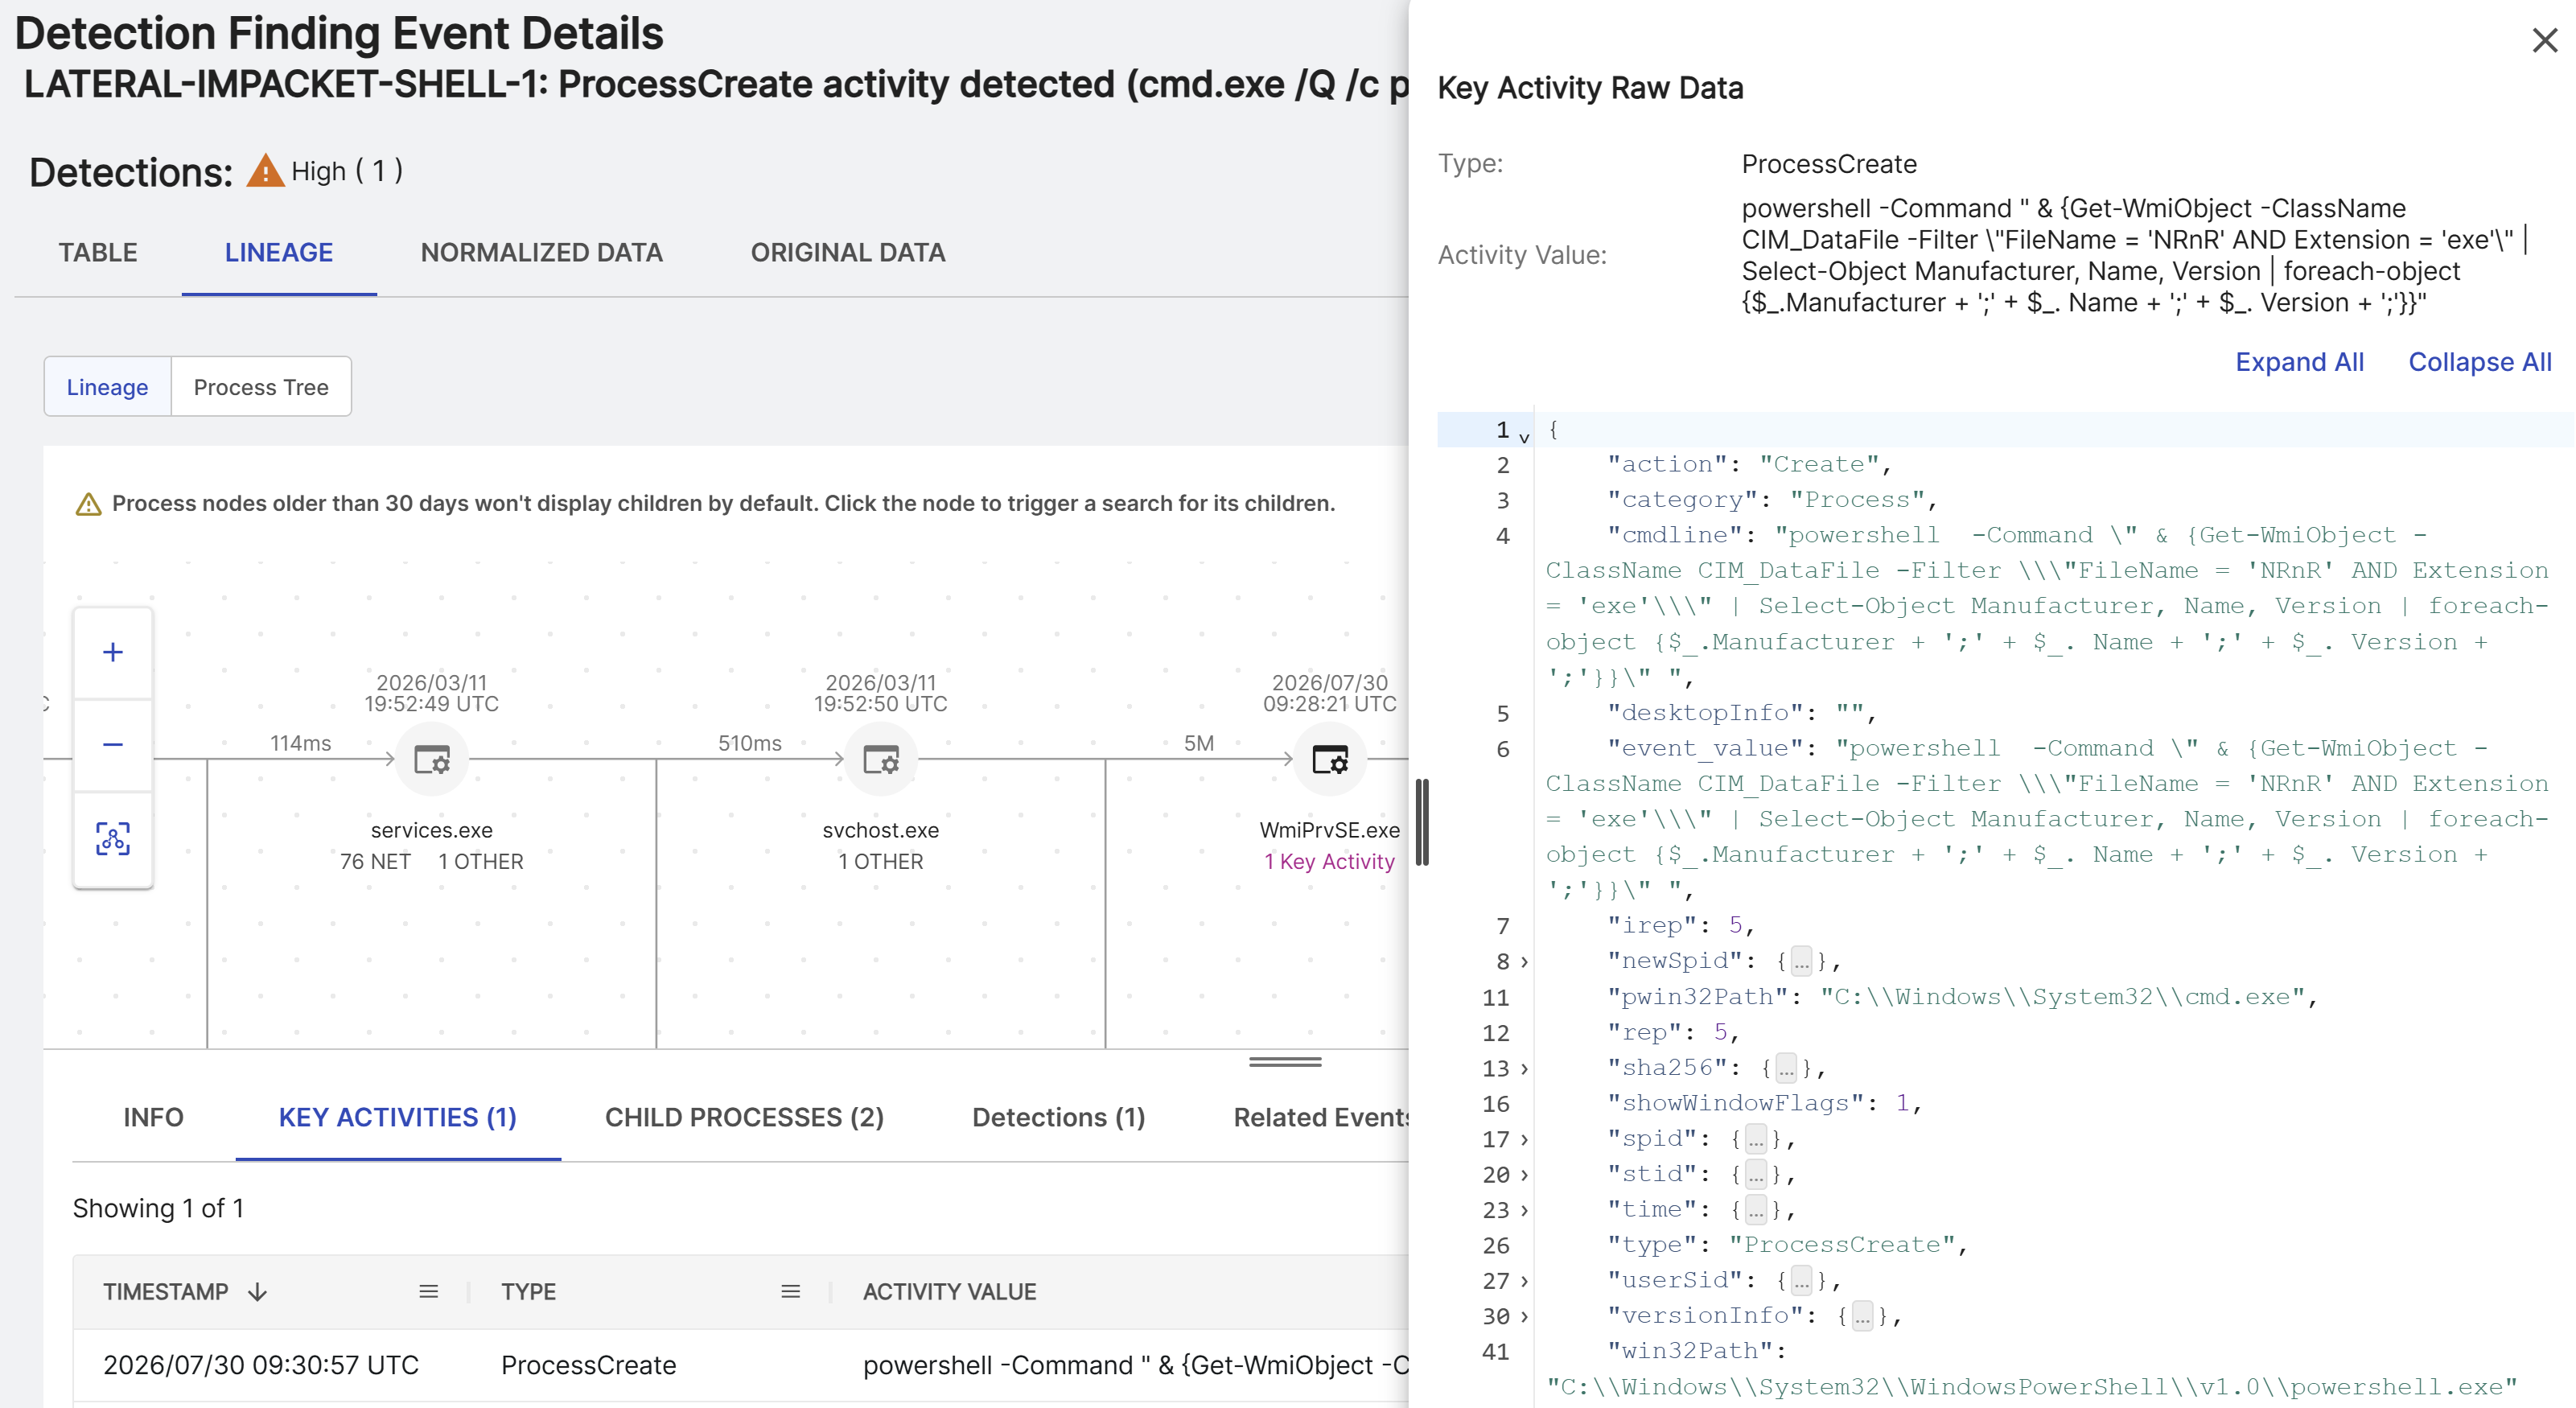
Raw Data: The entire raw data object. Click View Raw Data to see this in a slide-out.
See child processes
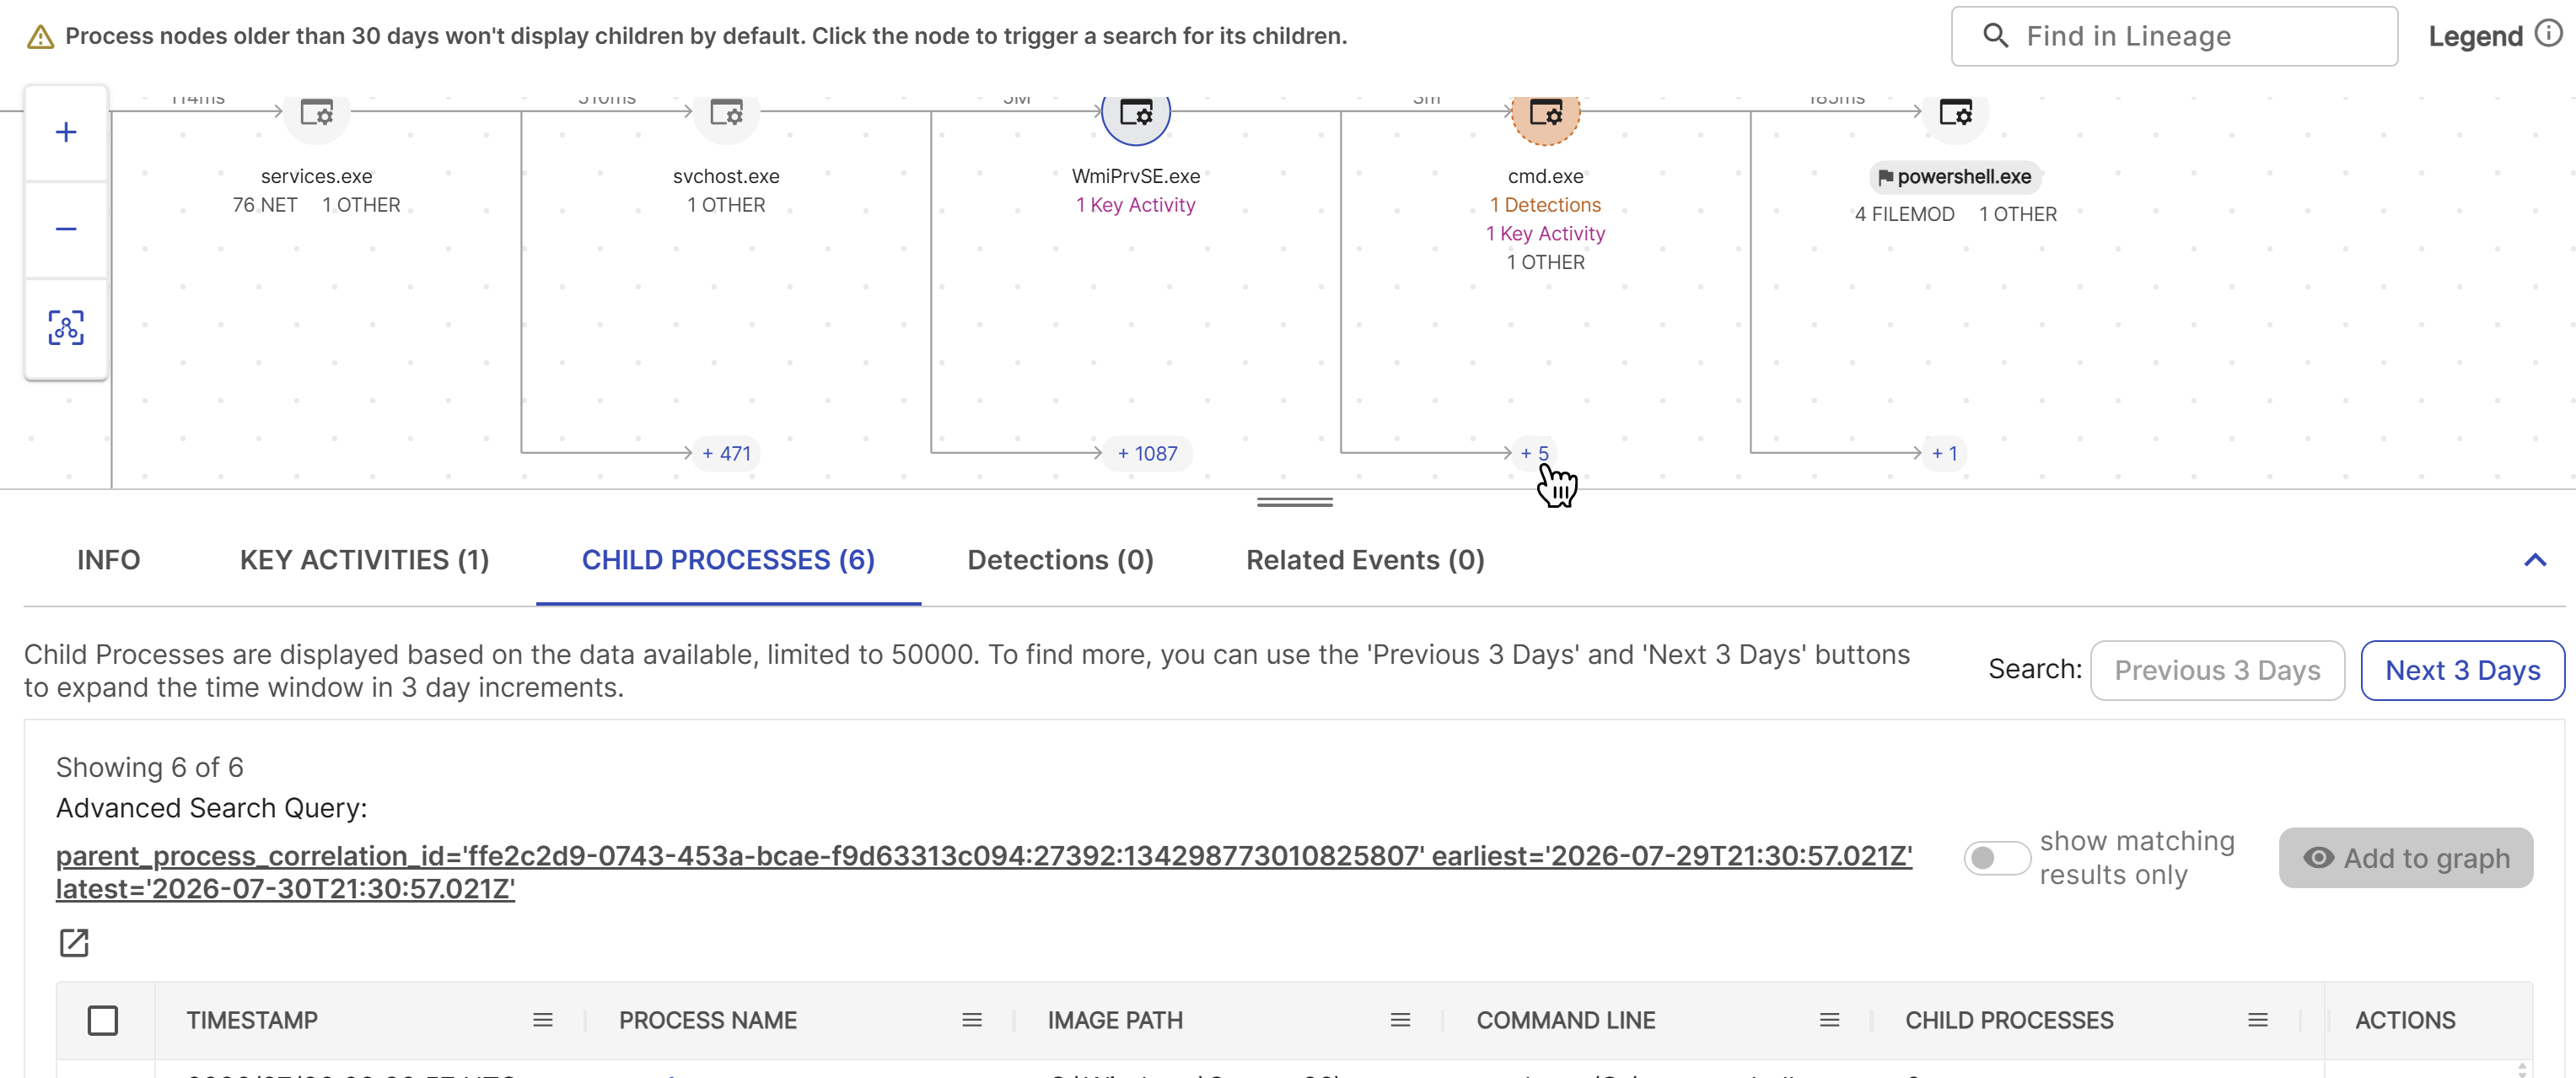
The Child Processes tab below the graph shows child process events of the selected process node. View the Child Processes tab in two ways:
- Click a number of child processes in the graph.
- Alternatively, click a process node in the graph and then select the Child Processes tab.
Click a process name to open the child event details in a new tab.
Show child processes in the lineage
You can add these child processes to the lineage graph to help investigate threats.
- To add a single child process, click the Eye icon in the Actions column. Click the icon again to hide the process.
- To add multiple child processes, click the checkboxes at the left to select the desired processes and click Add to Graph. To hide the processes, use the checkboxes and click Remove from Graph.
See associated detections
The Detections tab below the graph shows any detections generated from the selected process node. View the Detections tab in one of the following ways:
- Click a number of detections below a process node in the graph.
- Alternatively, click a process node in the graph and then select the Detections tab.
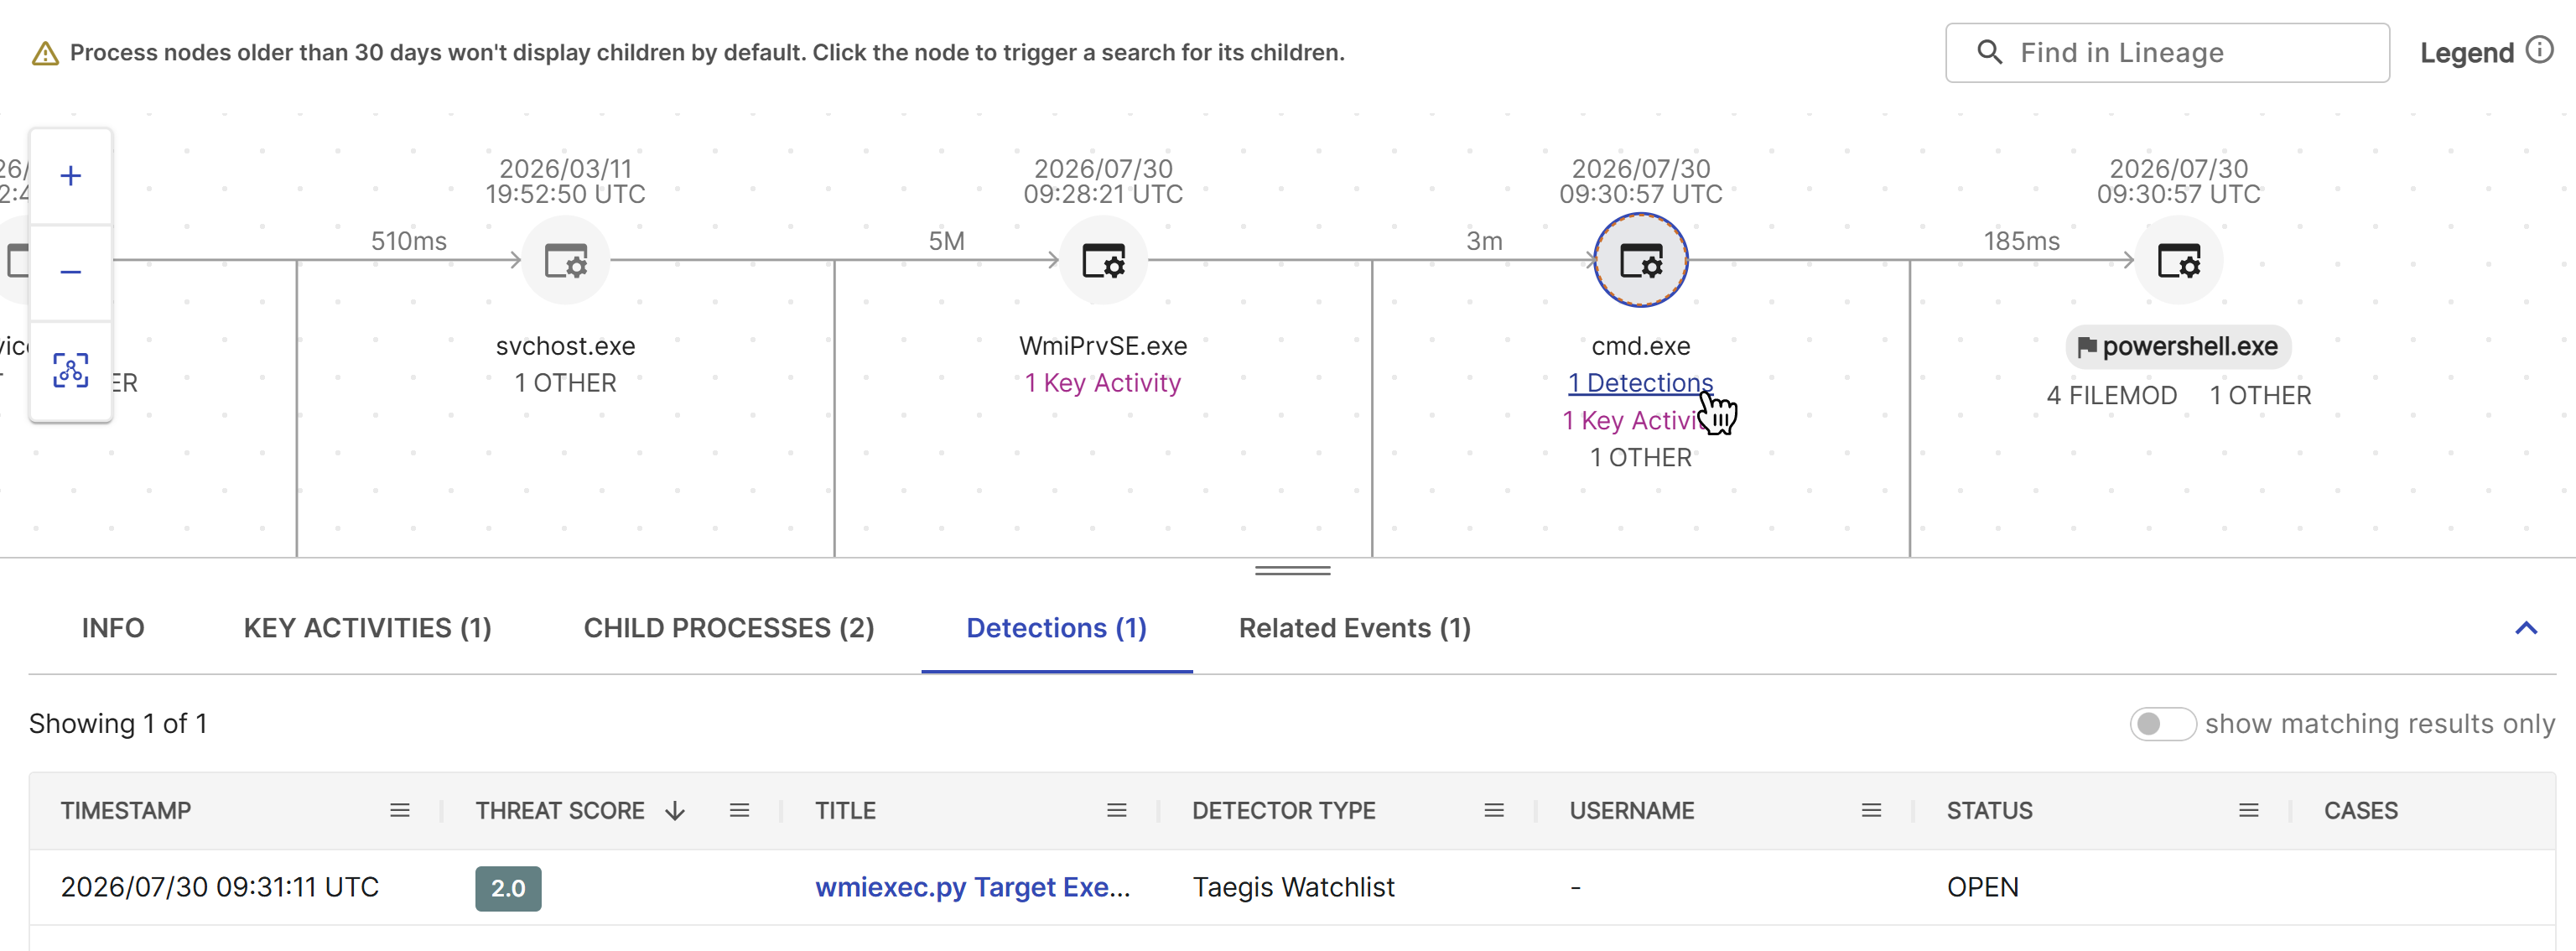
Click a Detection Title to open the details in a drawer without losing your place in the lineage graph.
See related events
The Related Events tab below the graph shows any related, correlated events associated with the selected process node. Related events are events that share the same process identifiers. This means they originated from the same process.
This helps you understand the event by examining other related event types captured in your environment.
Related events are labeled by type with a number in the graph beneath the process node. Supported related event types are as follows:
- DNS (dnsquery)
- File Mod (filemod)
- HTTP (http)
- Netflow (netflow)
- Registry (registry)
- Script Block (scriptblock)
All other event types are categorized as Other.
View the Related Events tab in two ways:
- Click a Related Events link below a process node in the graph.
- Alternatively, click a process node in the graph and then select the Related Events tab.
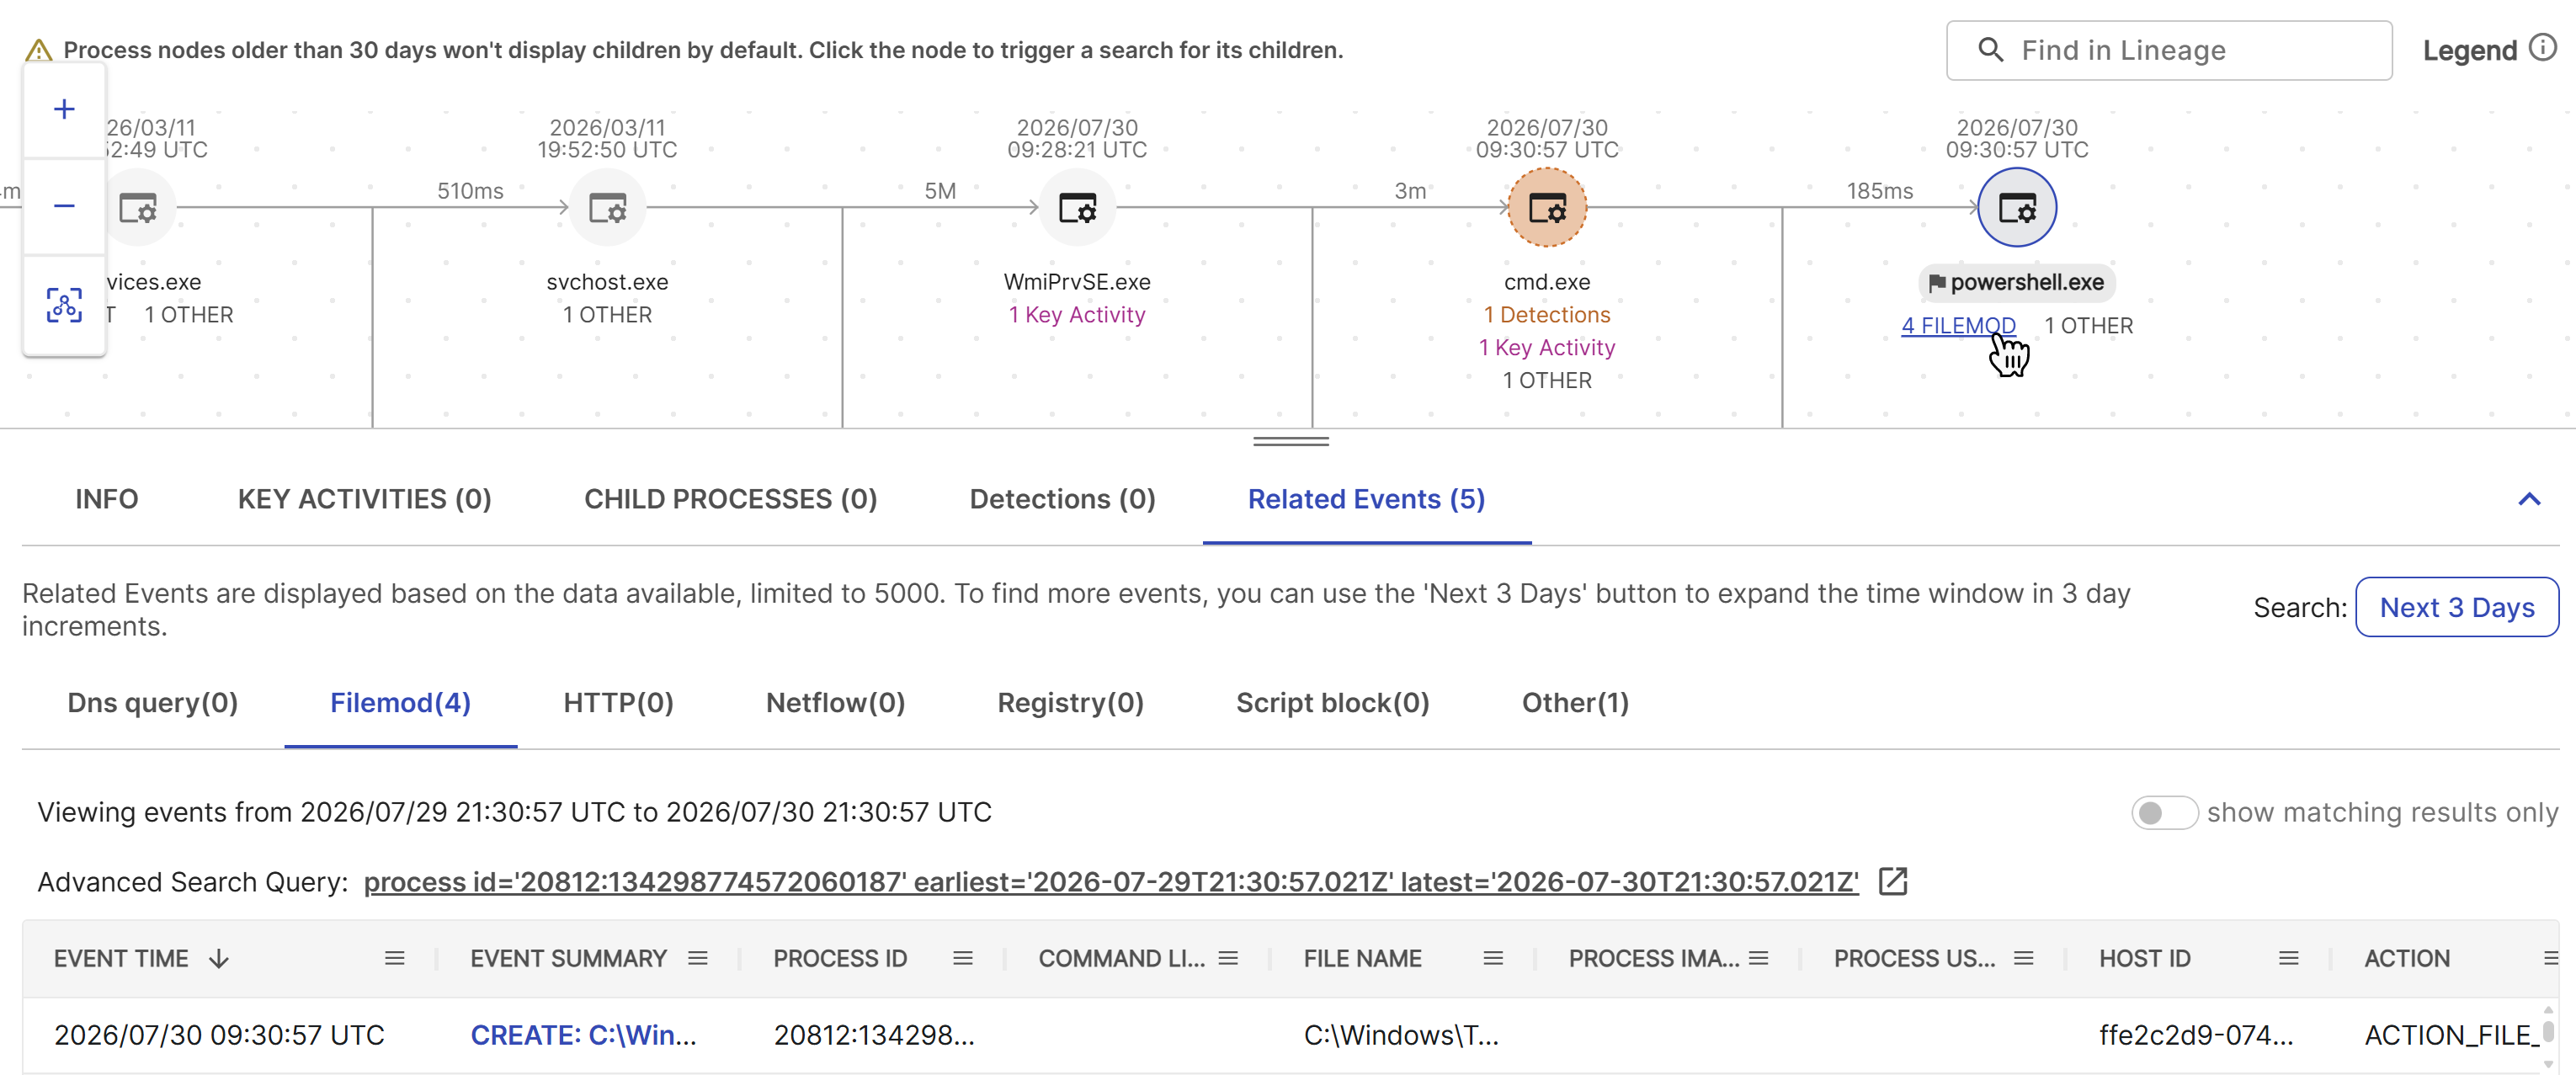
Click Next 3 Days to expand your search for related events in three-day increments past the default window of 24 hours after process creation.
Search a lineage
Enter a string in the search box to search the loaded event lineage. The search checks all loaded lineage data and supporting data using a contains match. Lineage process nodes with matching strings and supporting data are highlighted.
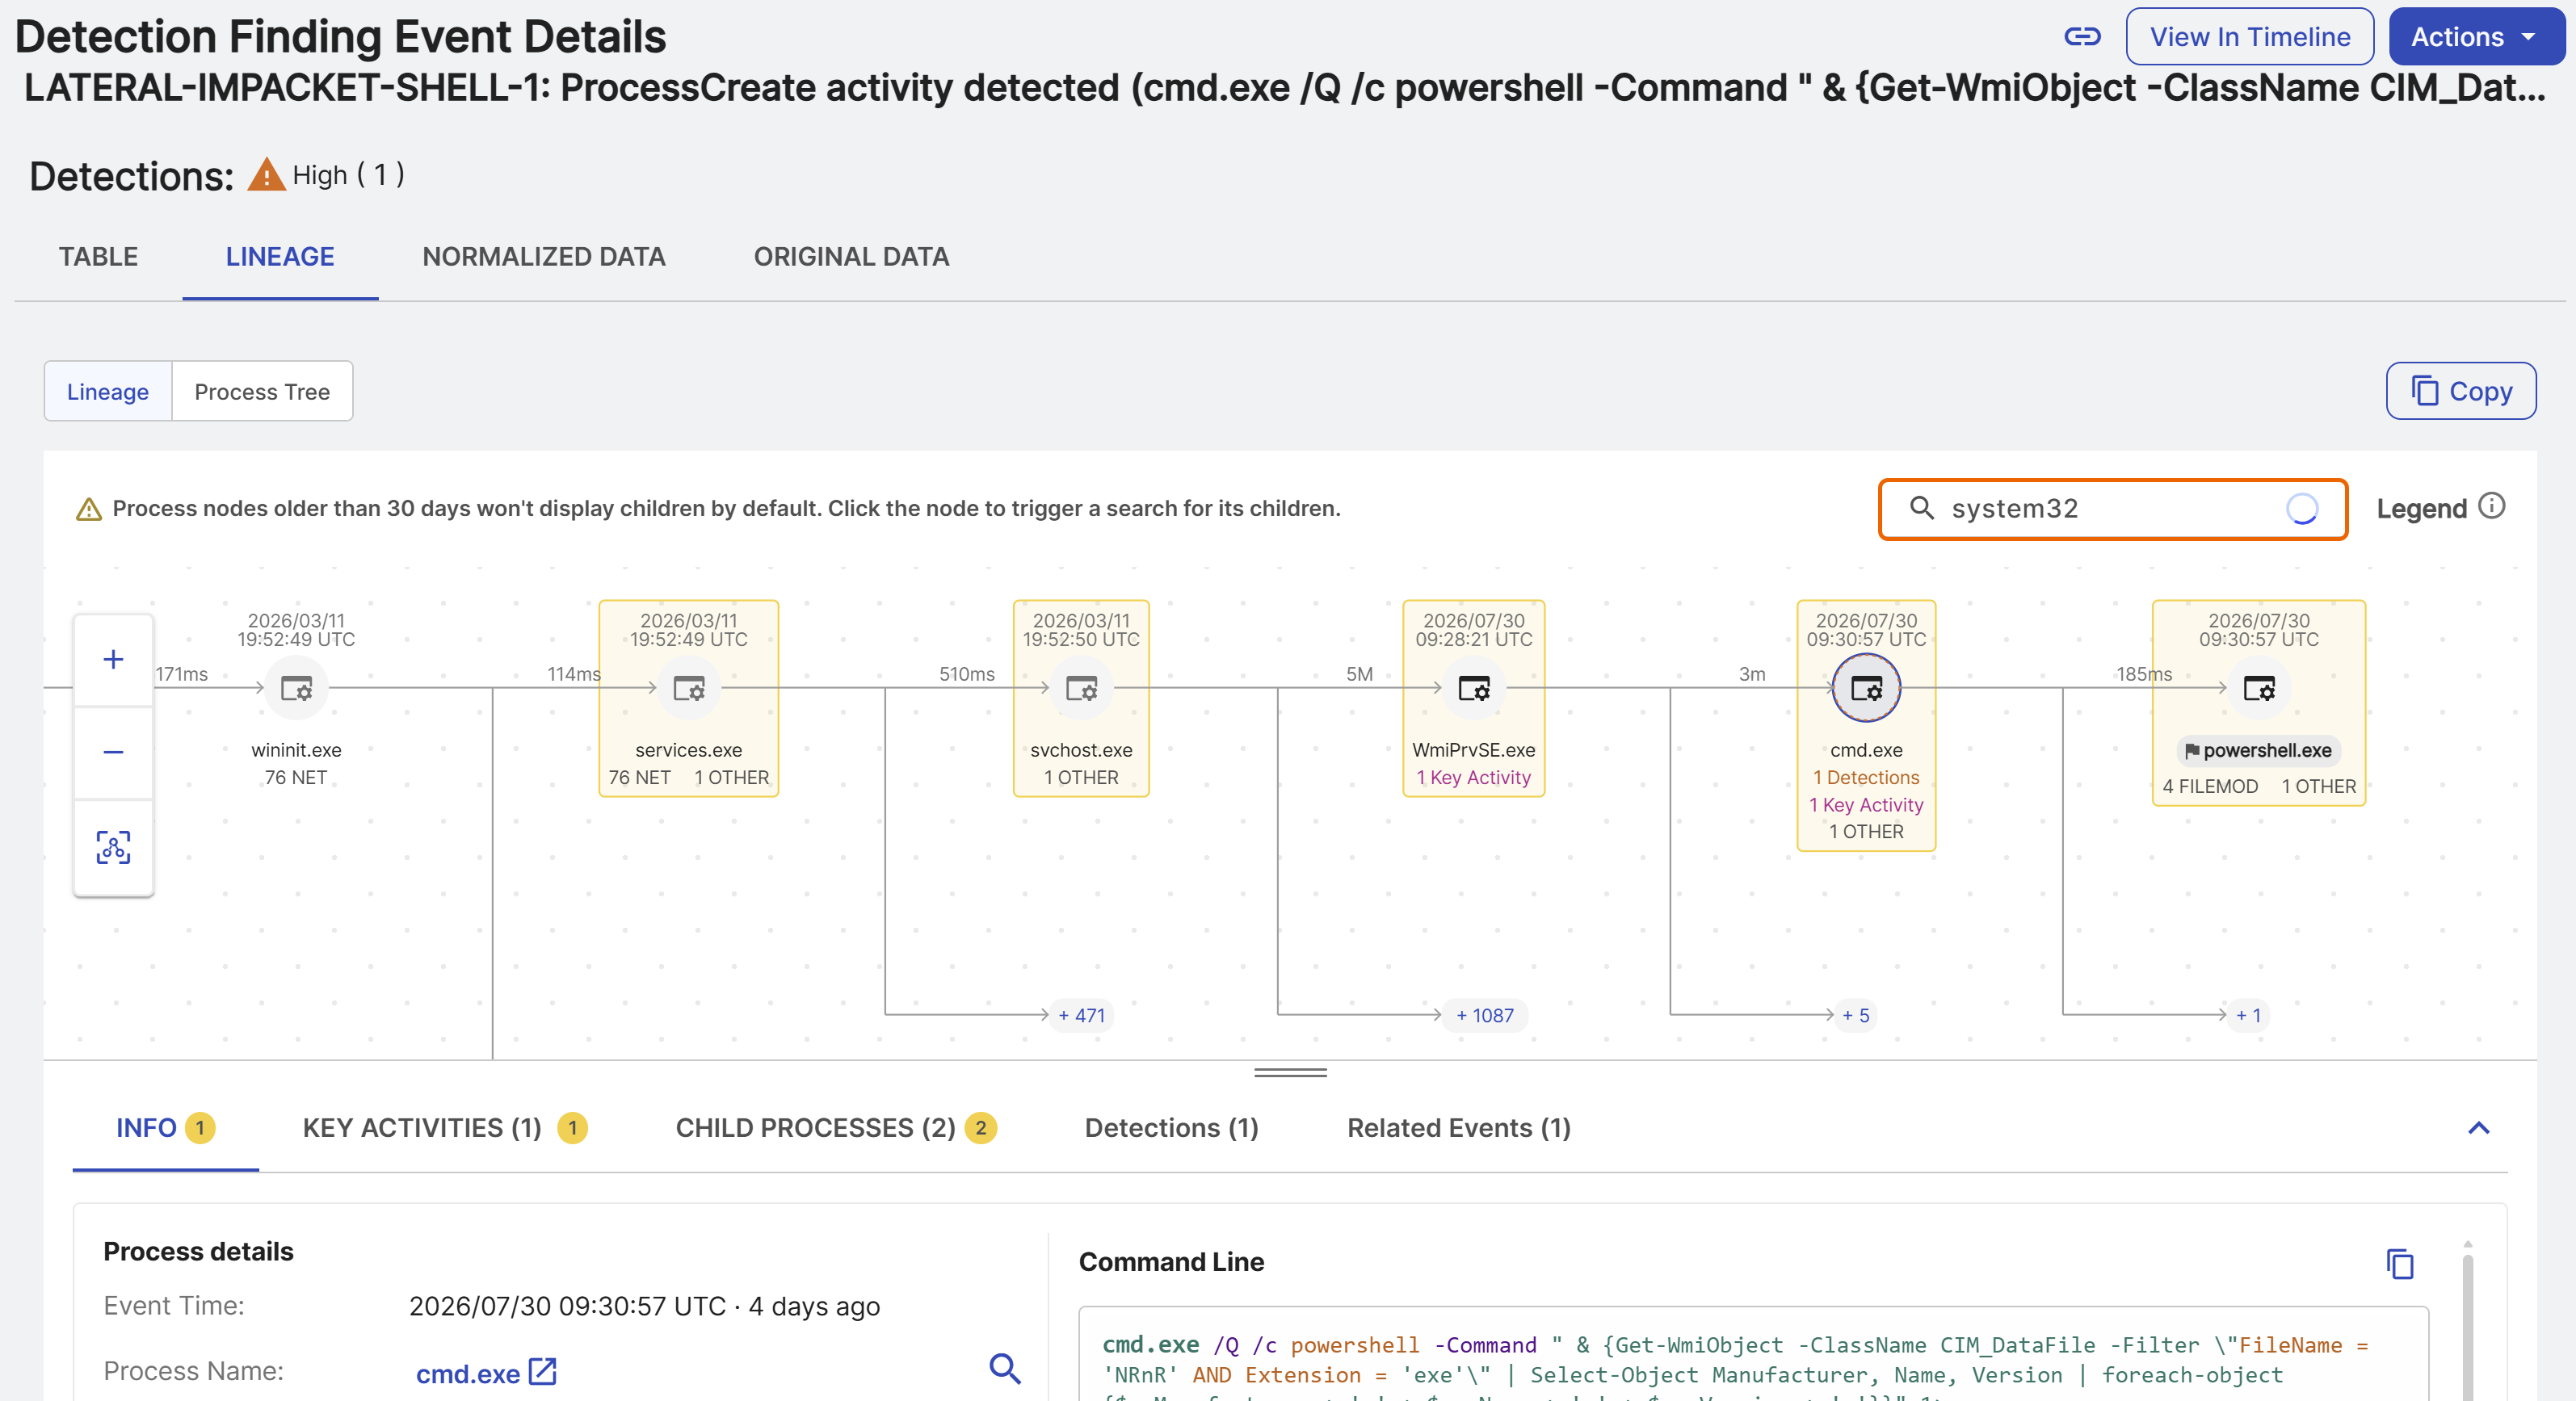
Click Previous 3 Days or Next 3 Days to load additional data. The search is automatically applied against new data as it loads.
Tip
Click the toggle to show only lineage objects with matching search results.
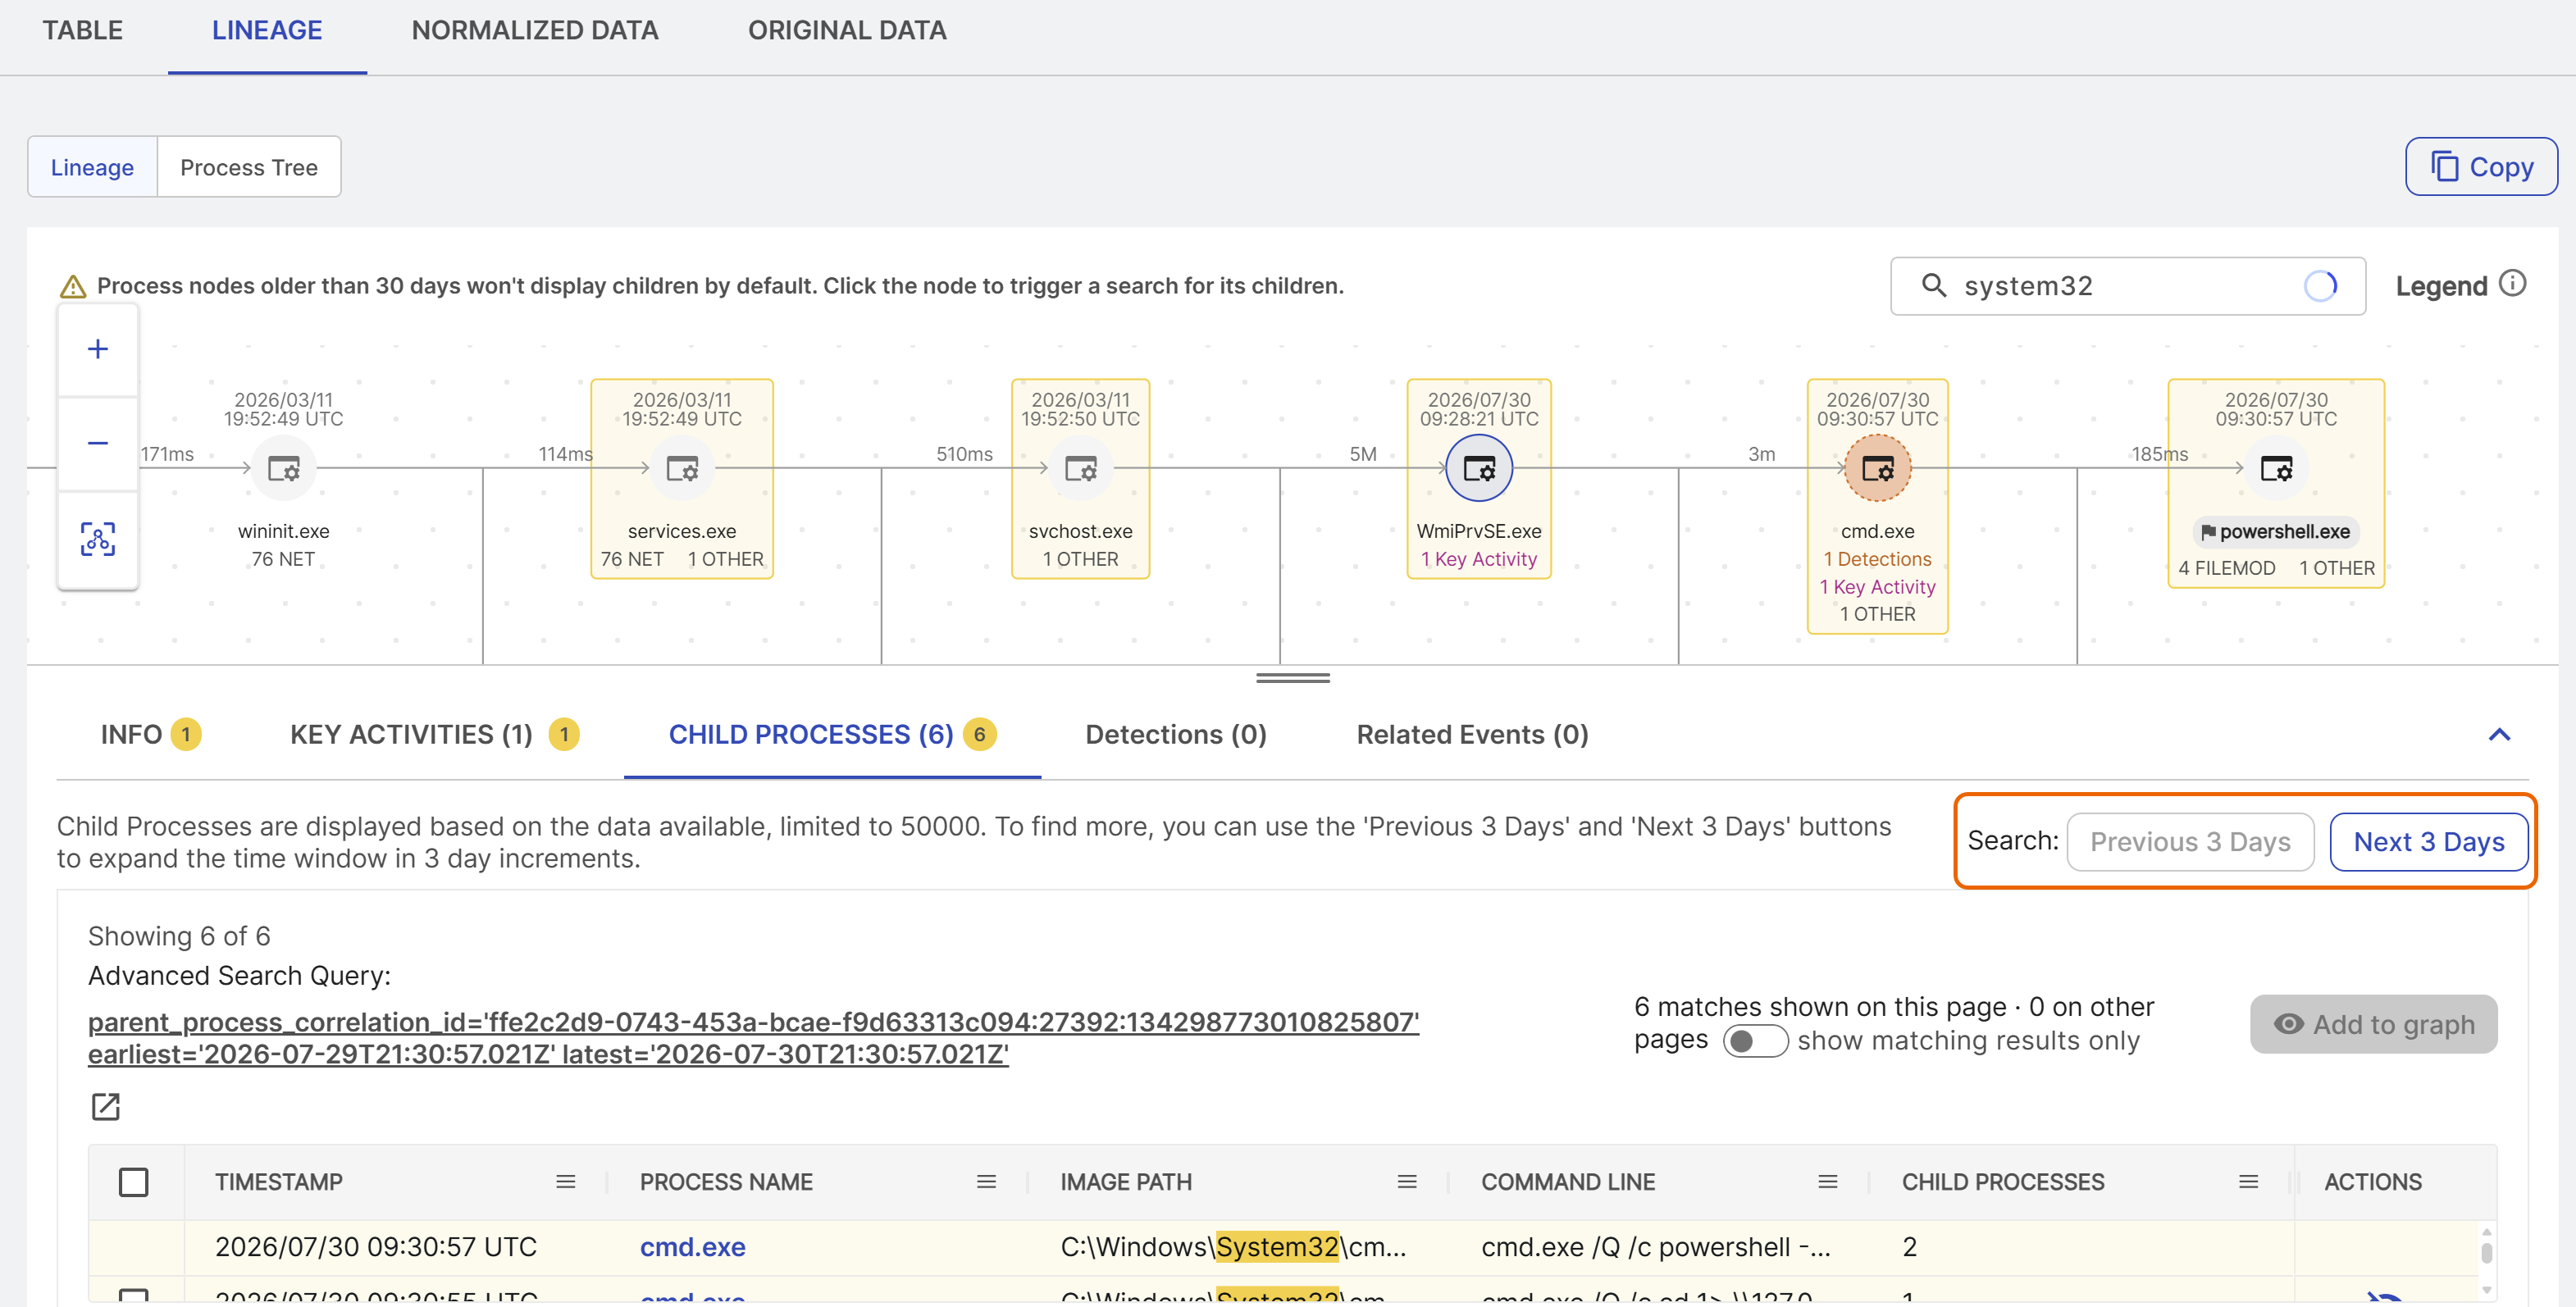
Matching key activity search results get highlighted.
Search specific processes with the IN operator
Use the IN operator to search within specific processes instead of searching all loaded lineage data. Do as follows:
-
Enter
in:in the search box.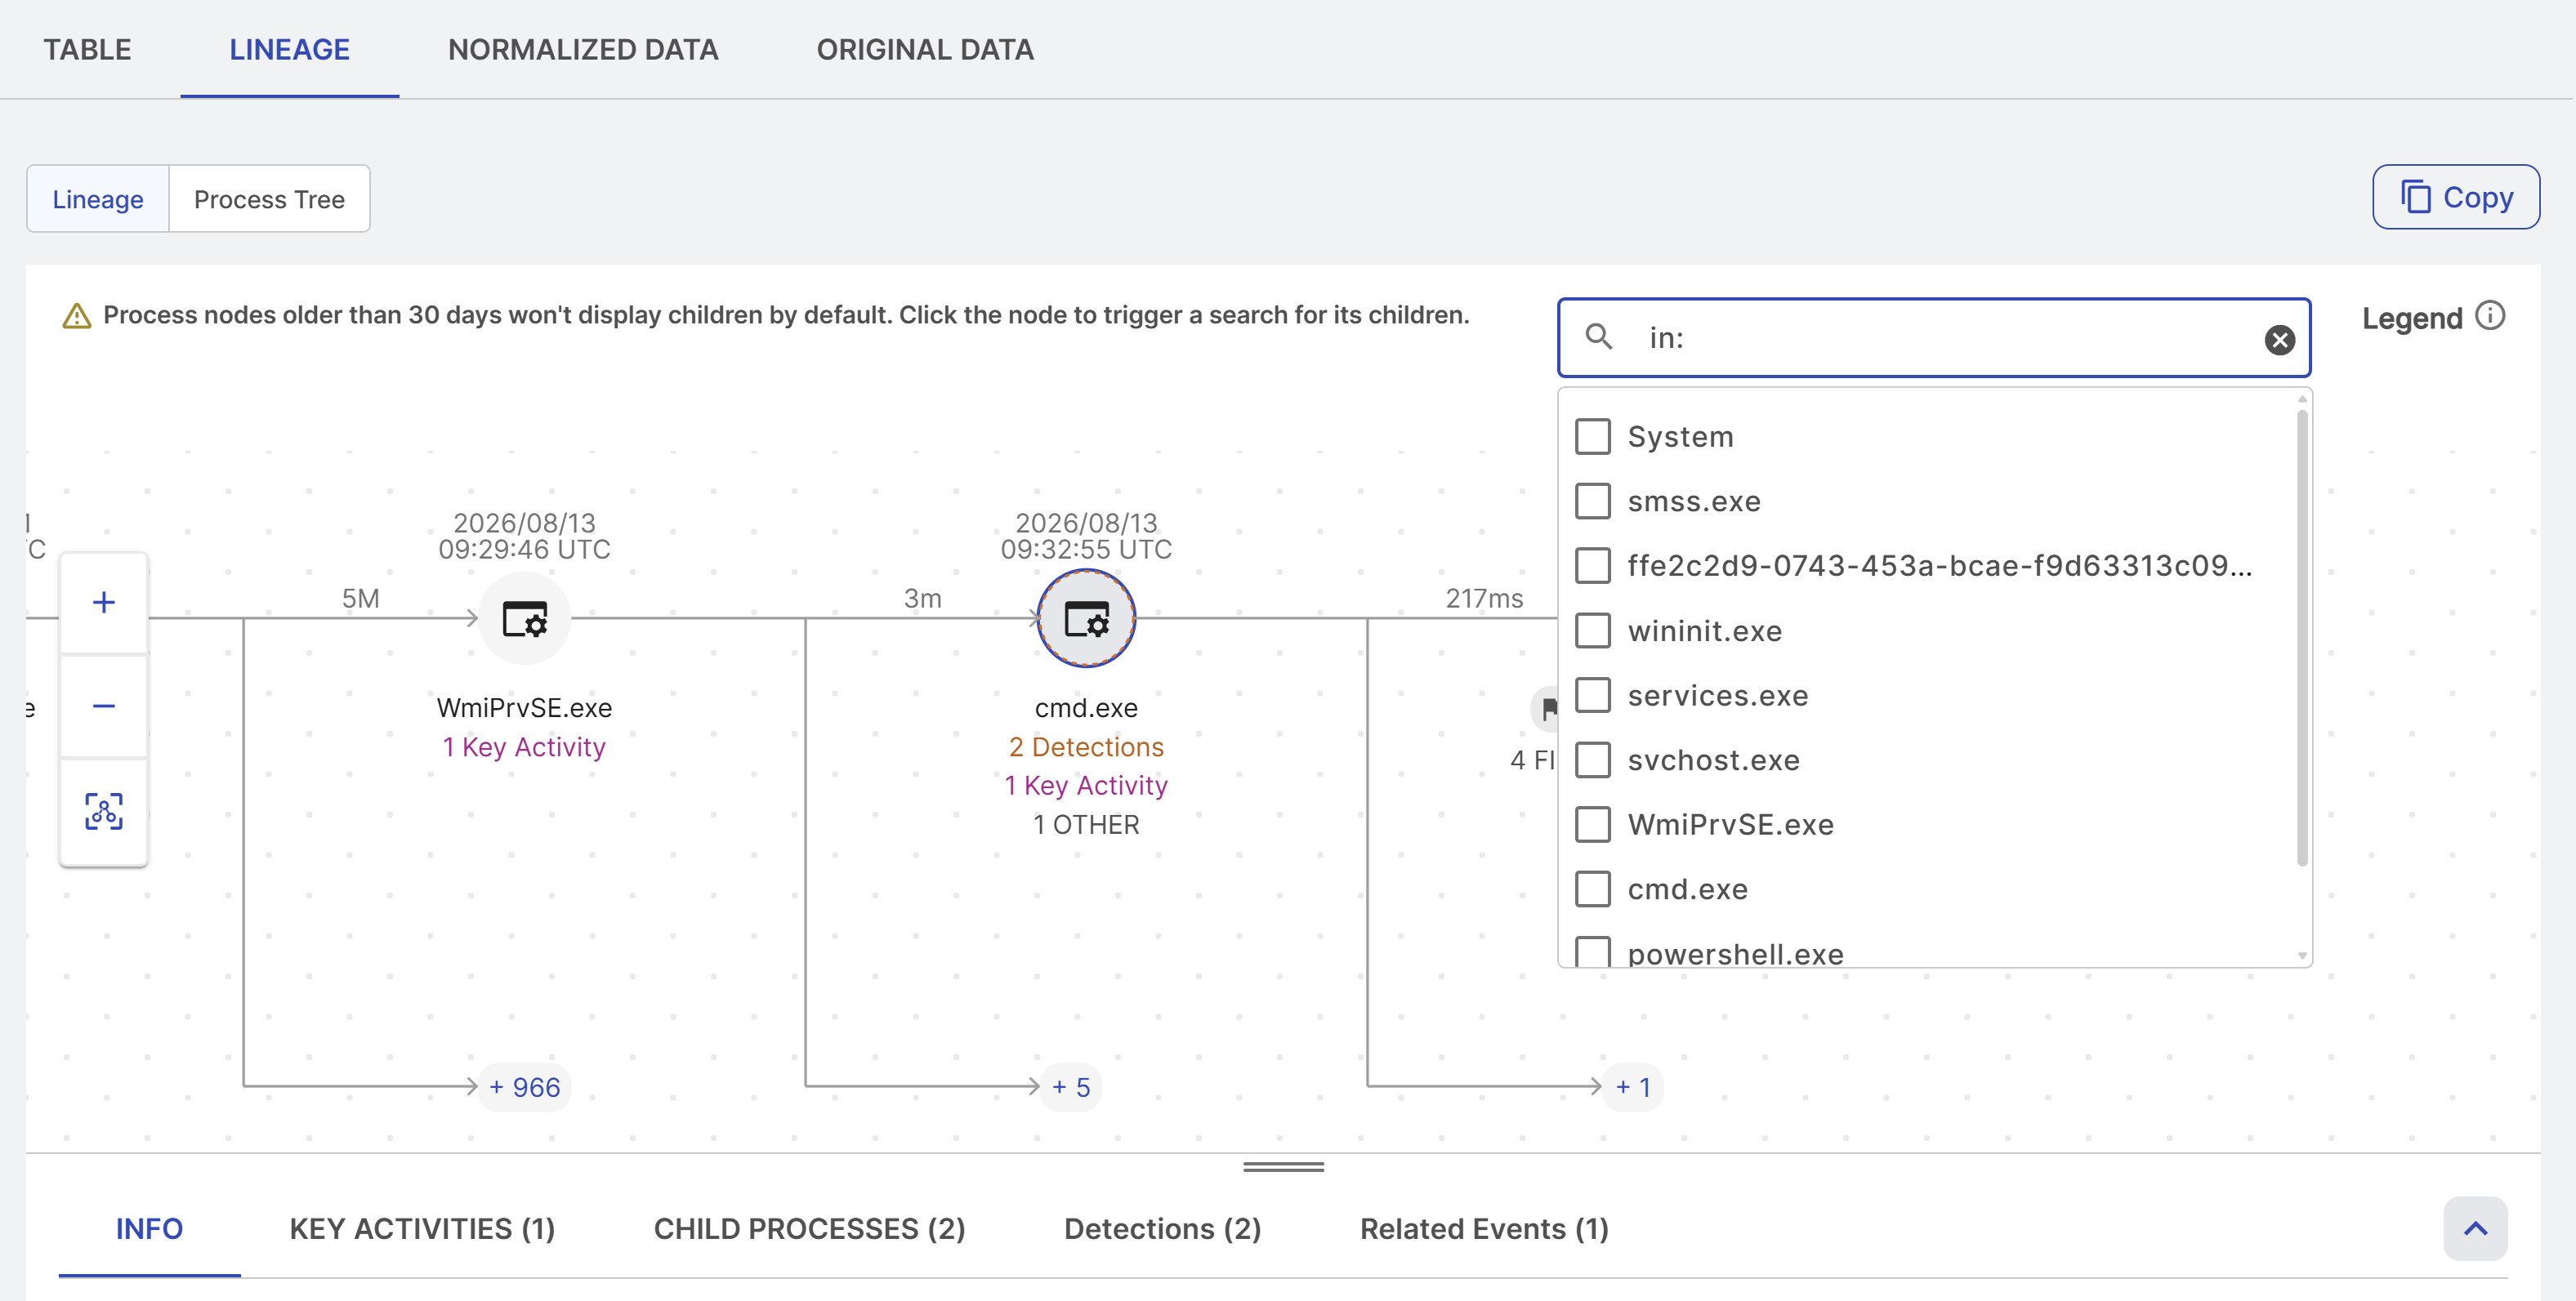
-
Select the processes you want to search.
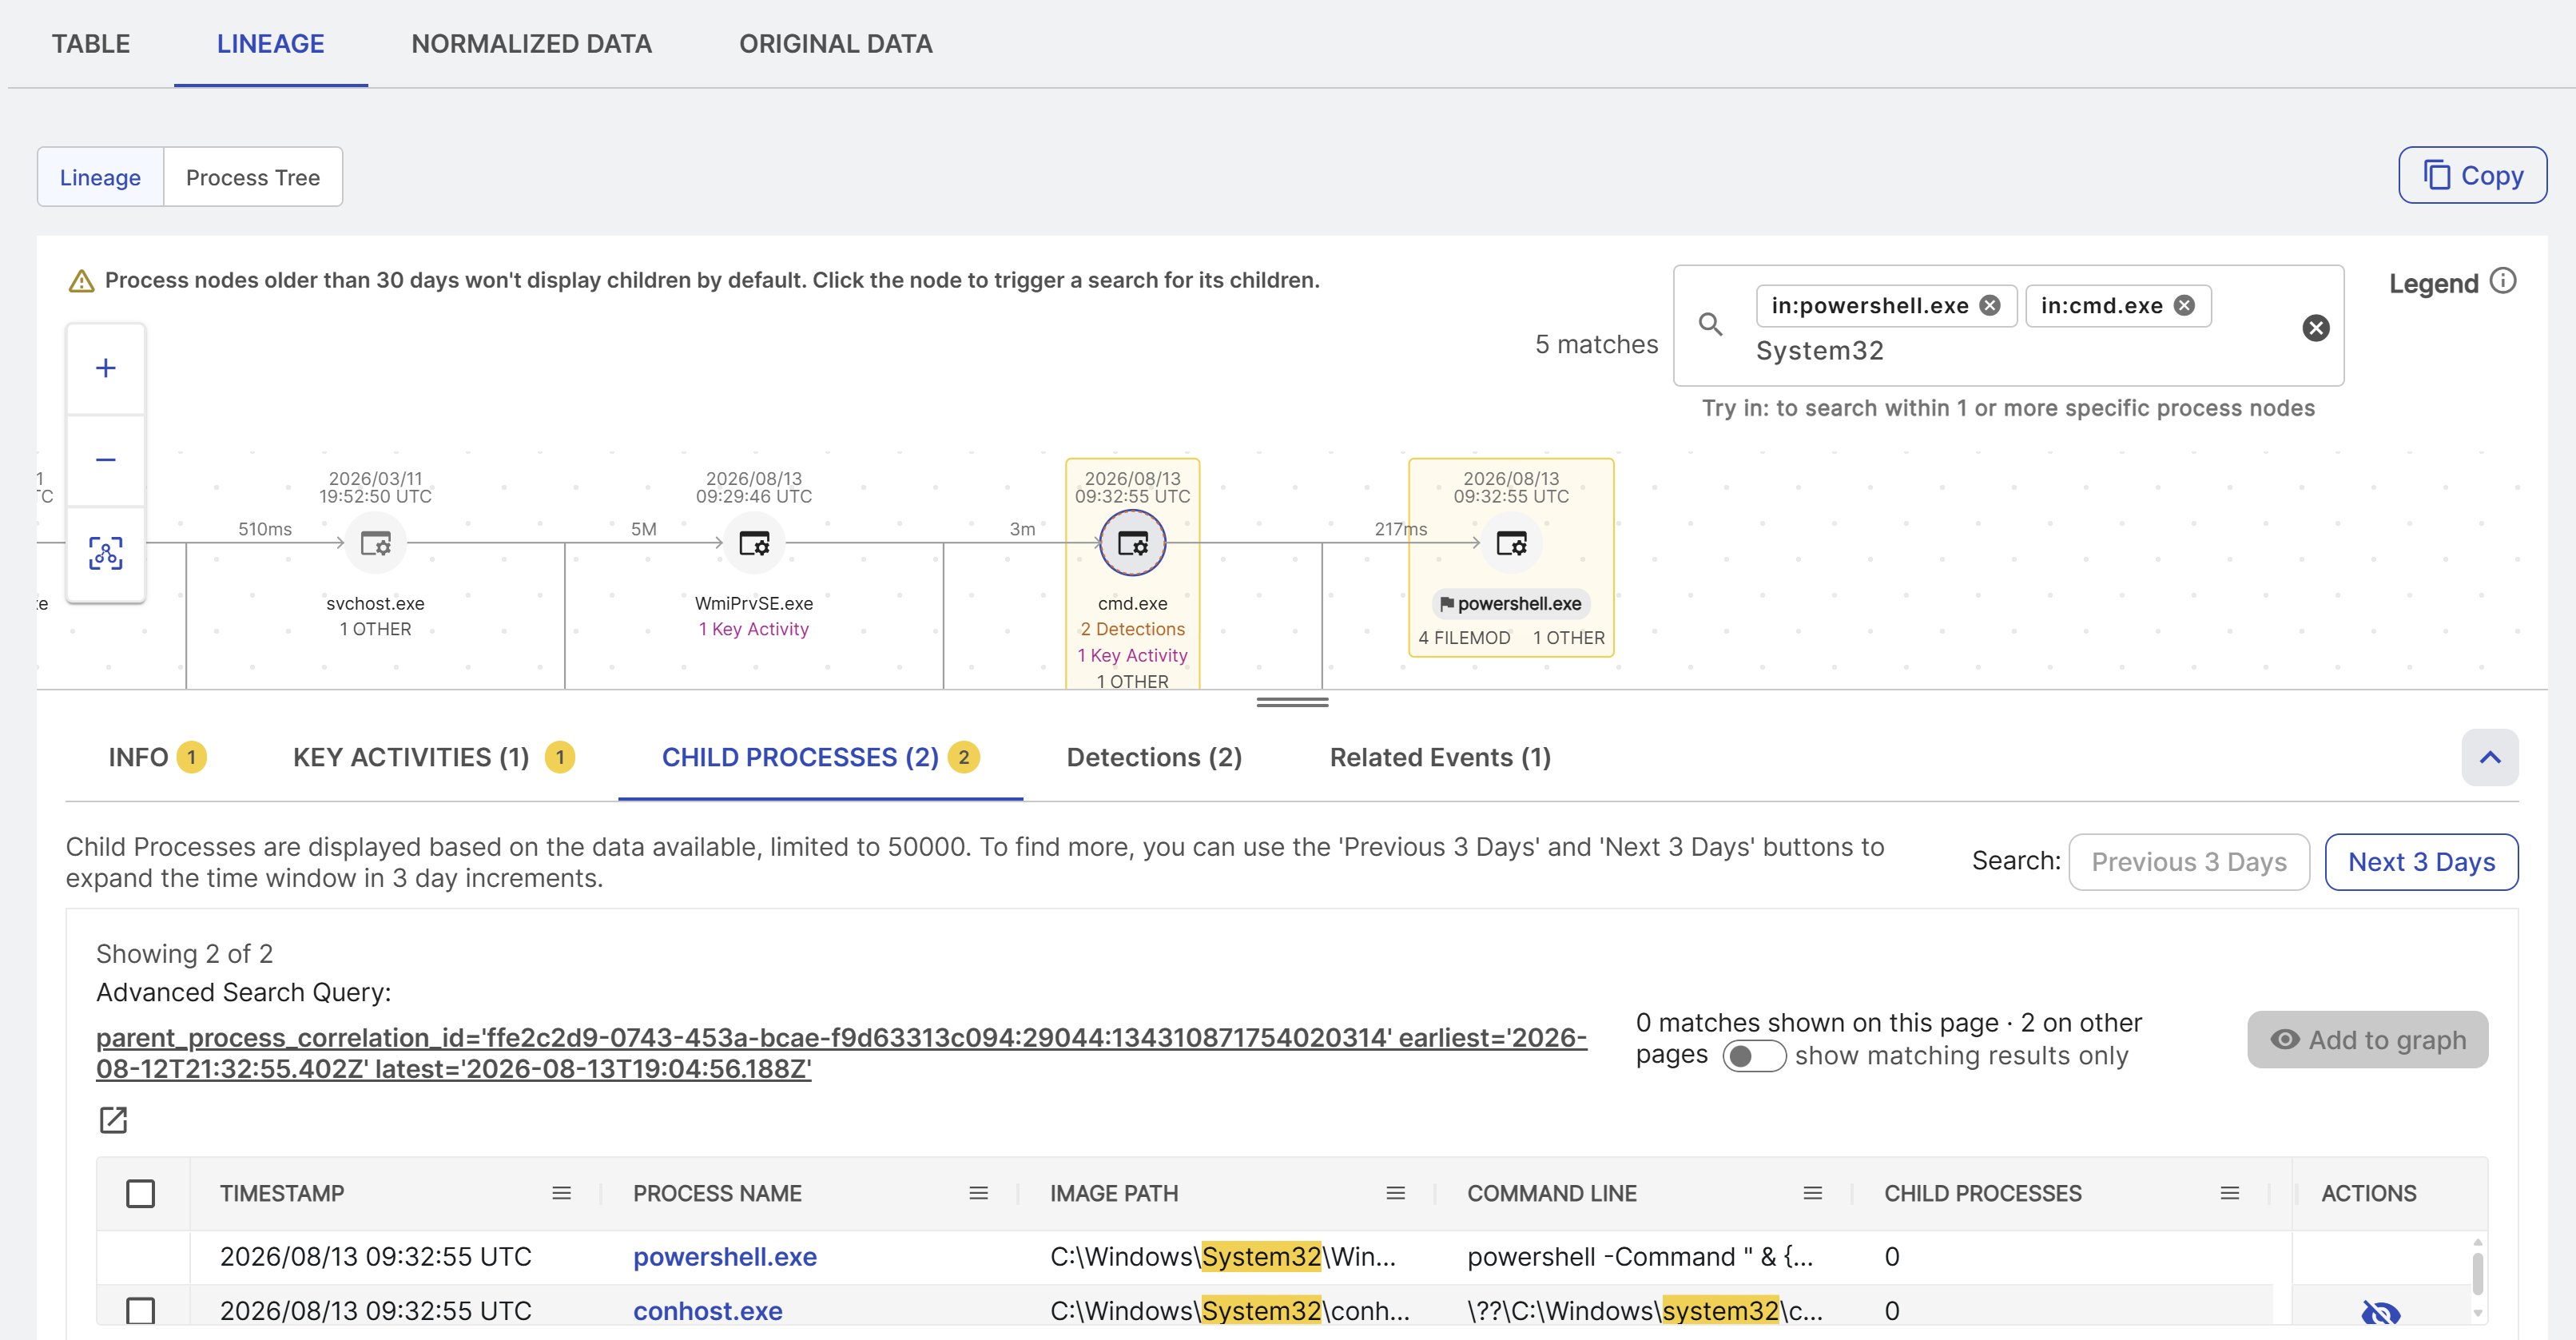
-
Enter the search string.
Matching child processes and supporting information are highlighted in the lineage.
Copy the lineage
To copy the displayed lineage graph as a text-based process tree of nodes to your clipboard, click Copy from the top right of the graph. You can add the copied tree to case notes.
Process tree view
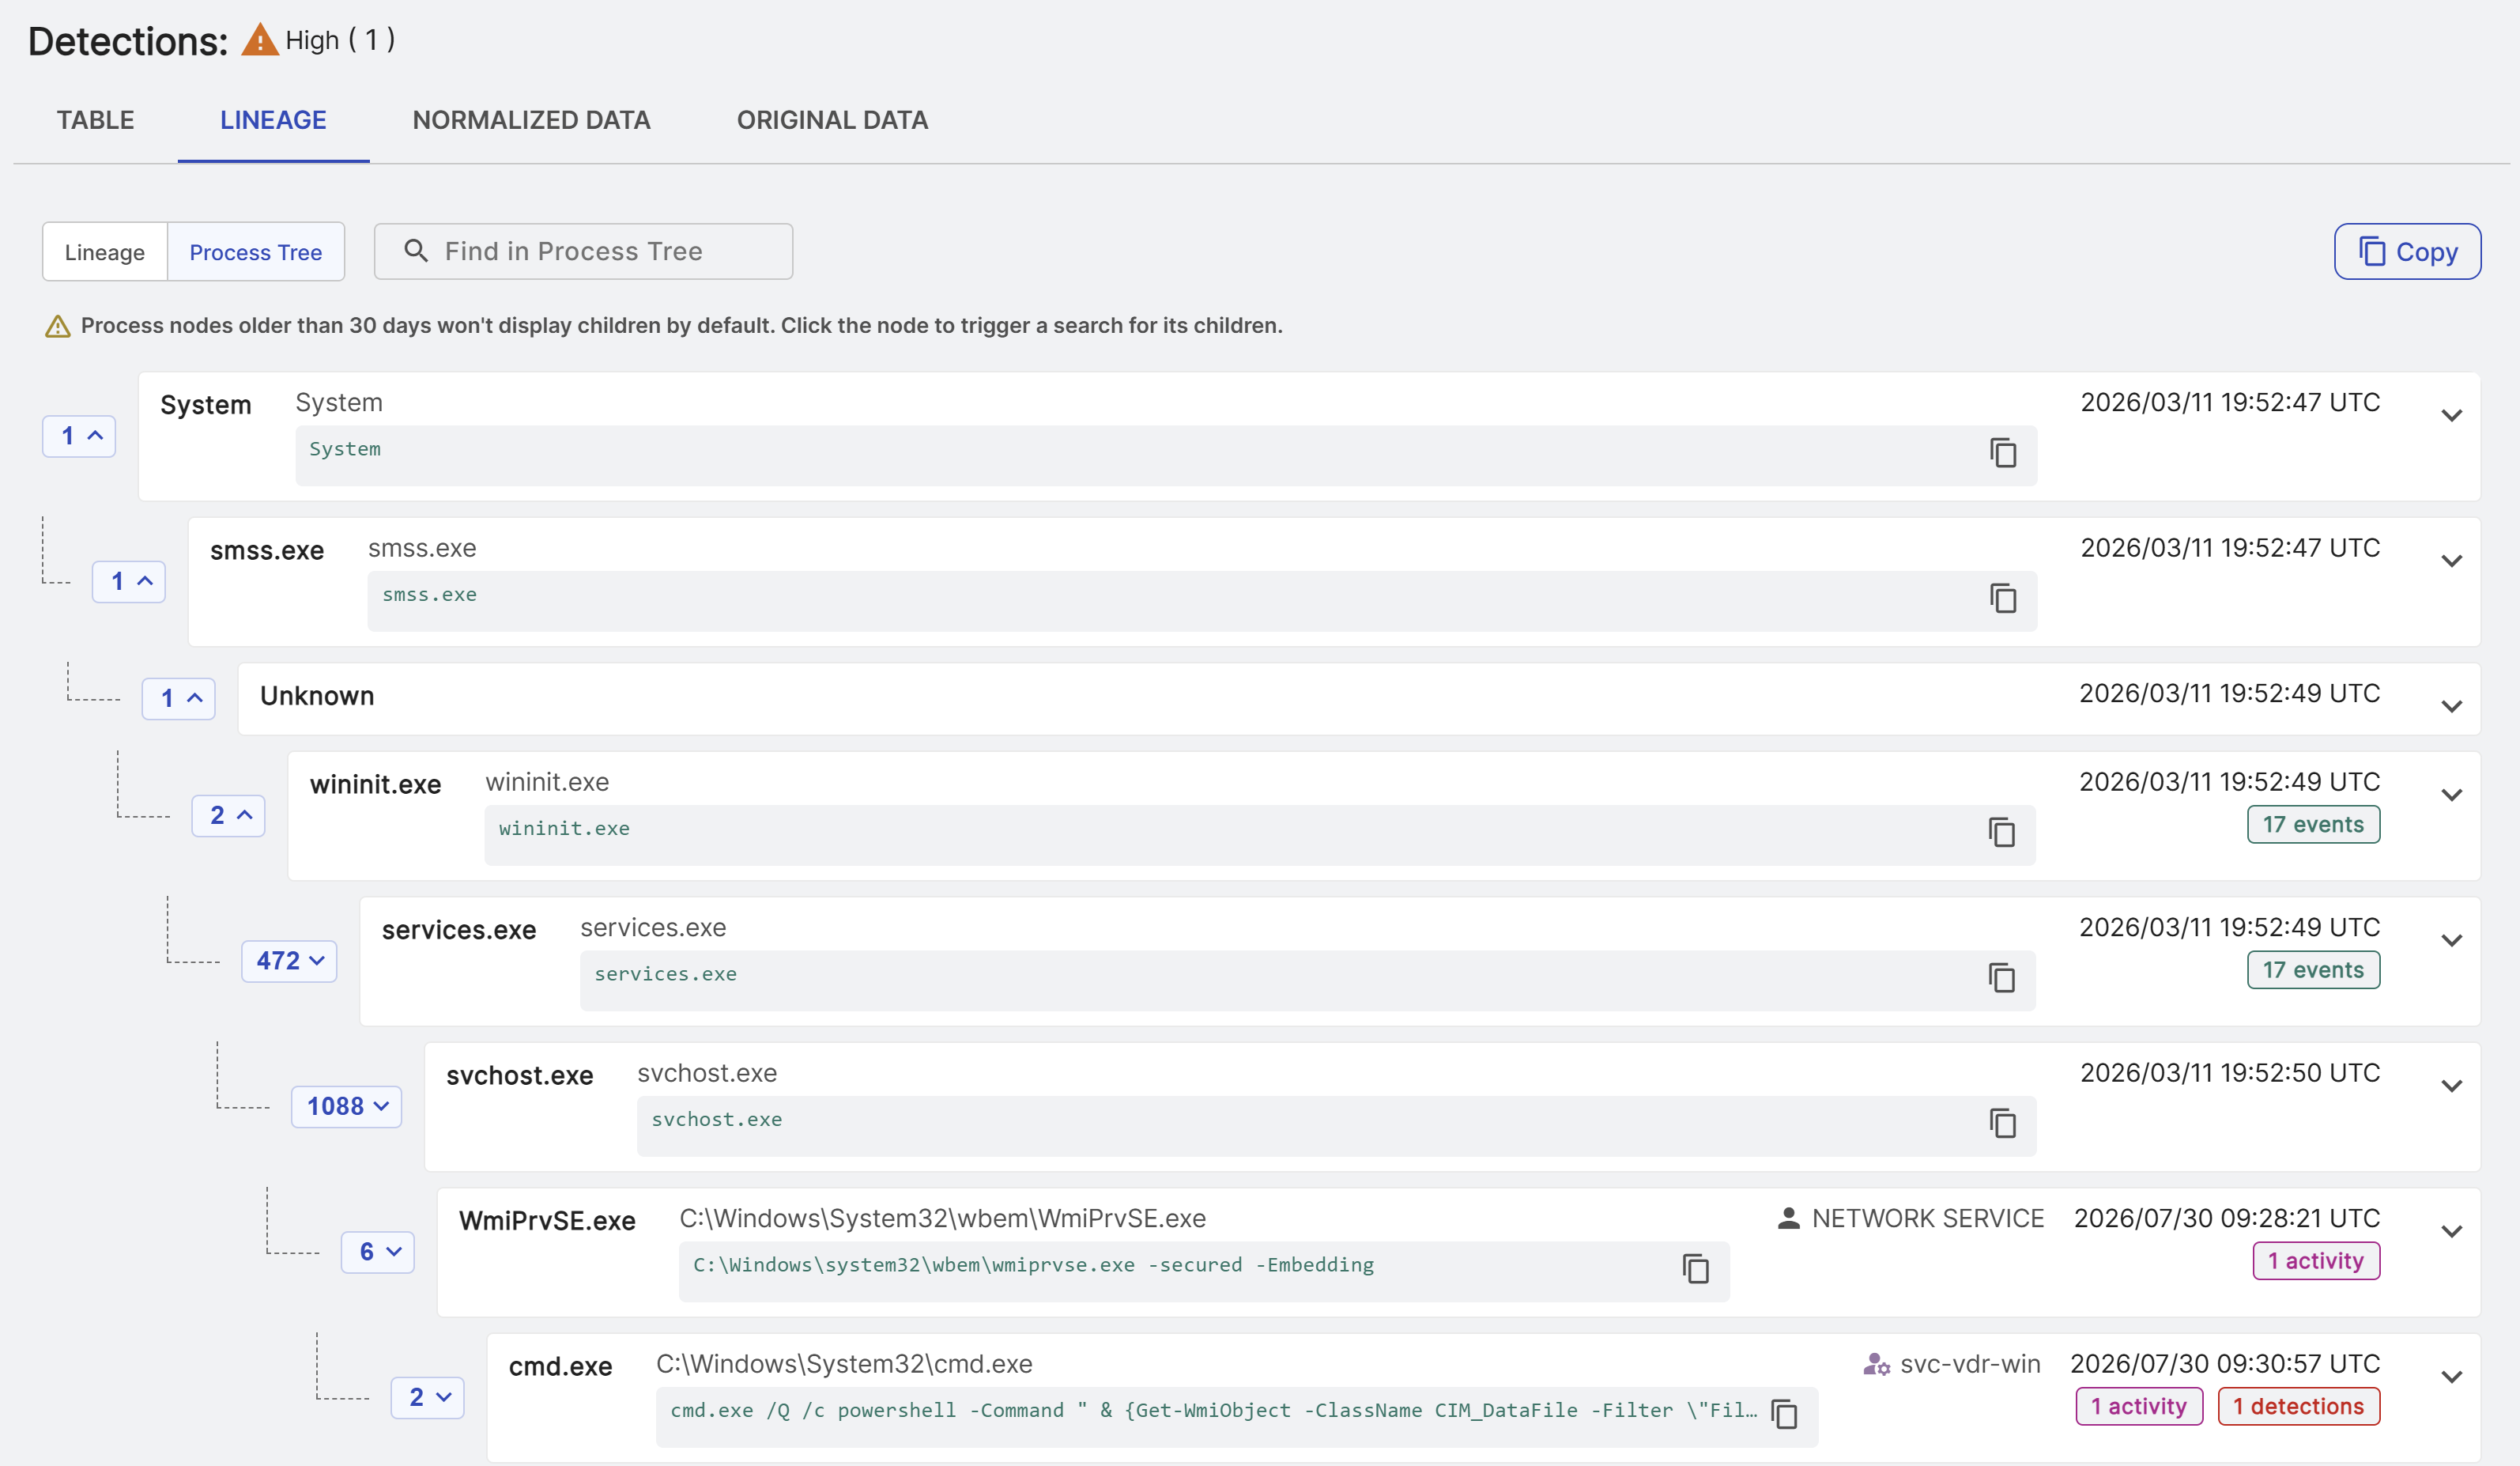
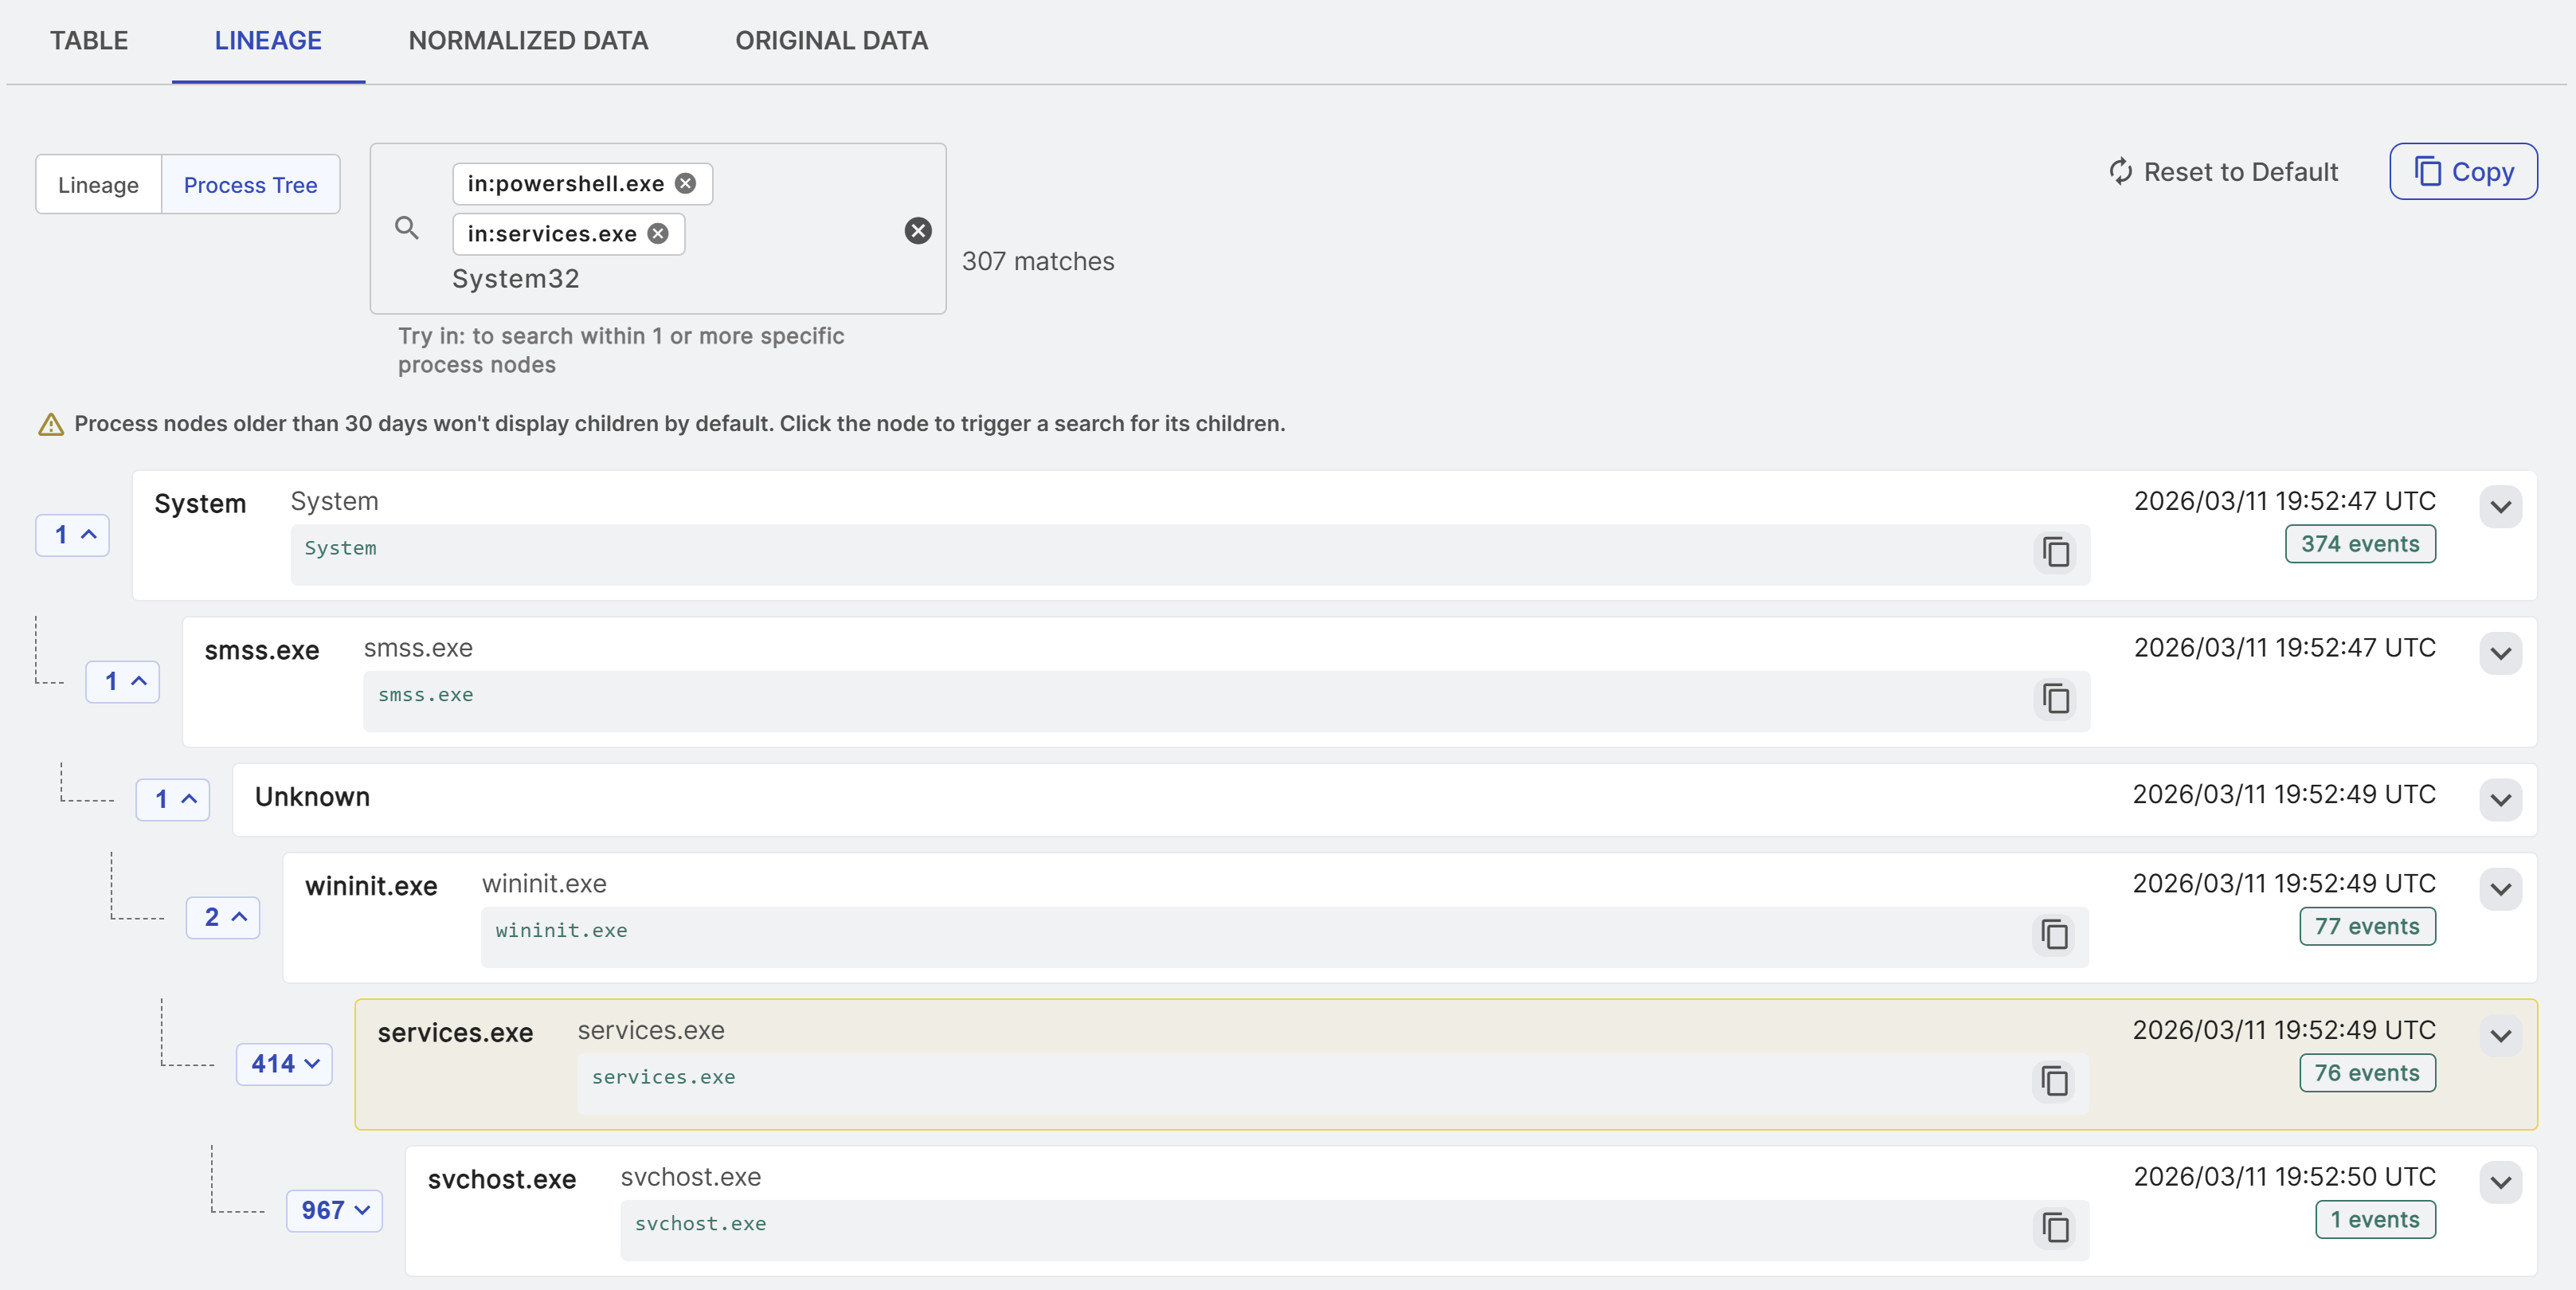
The Process Tree view gives you a quick view of the parent process and all related siblings and child processes. Top level process attributes, such as image path, command line, and username, are clearly visible in each node.
It's designed for speed and quick viewing. Key data objects, related detections, and key activities are linked when present.
View a process tree
To view a process tree, do as follows:
-
Open a process or detection finding event details page. Events are visible in search results, cases, and detection details pages. For more information on event types, see Events.
How to find process and detection finding events
Search for process and detection finding events in Data Lake Search with the following queries:
FROM processandFROM detectionfinding. -
In the event details, click the Lineage tab.
- Click Process Tree.
- The visualization displays the full process tree including siblings and children.
Expand and collapse a process tree
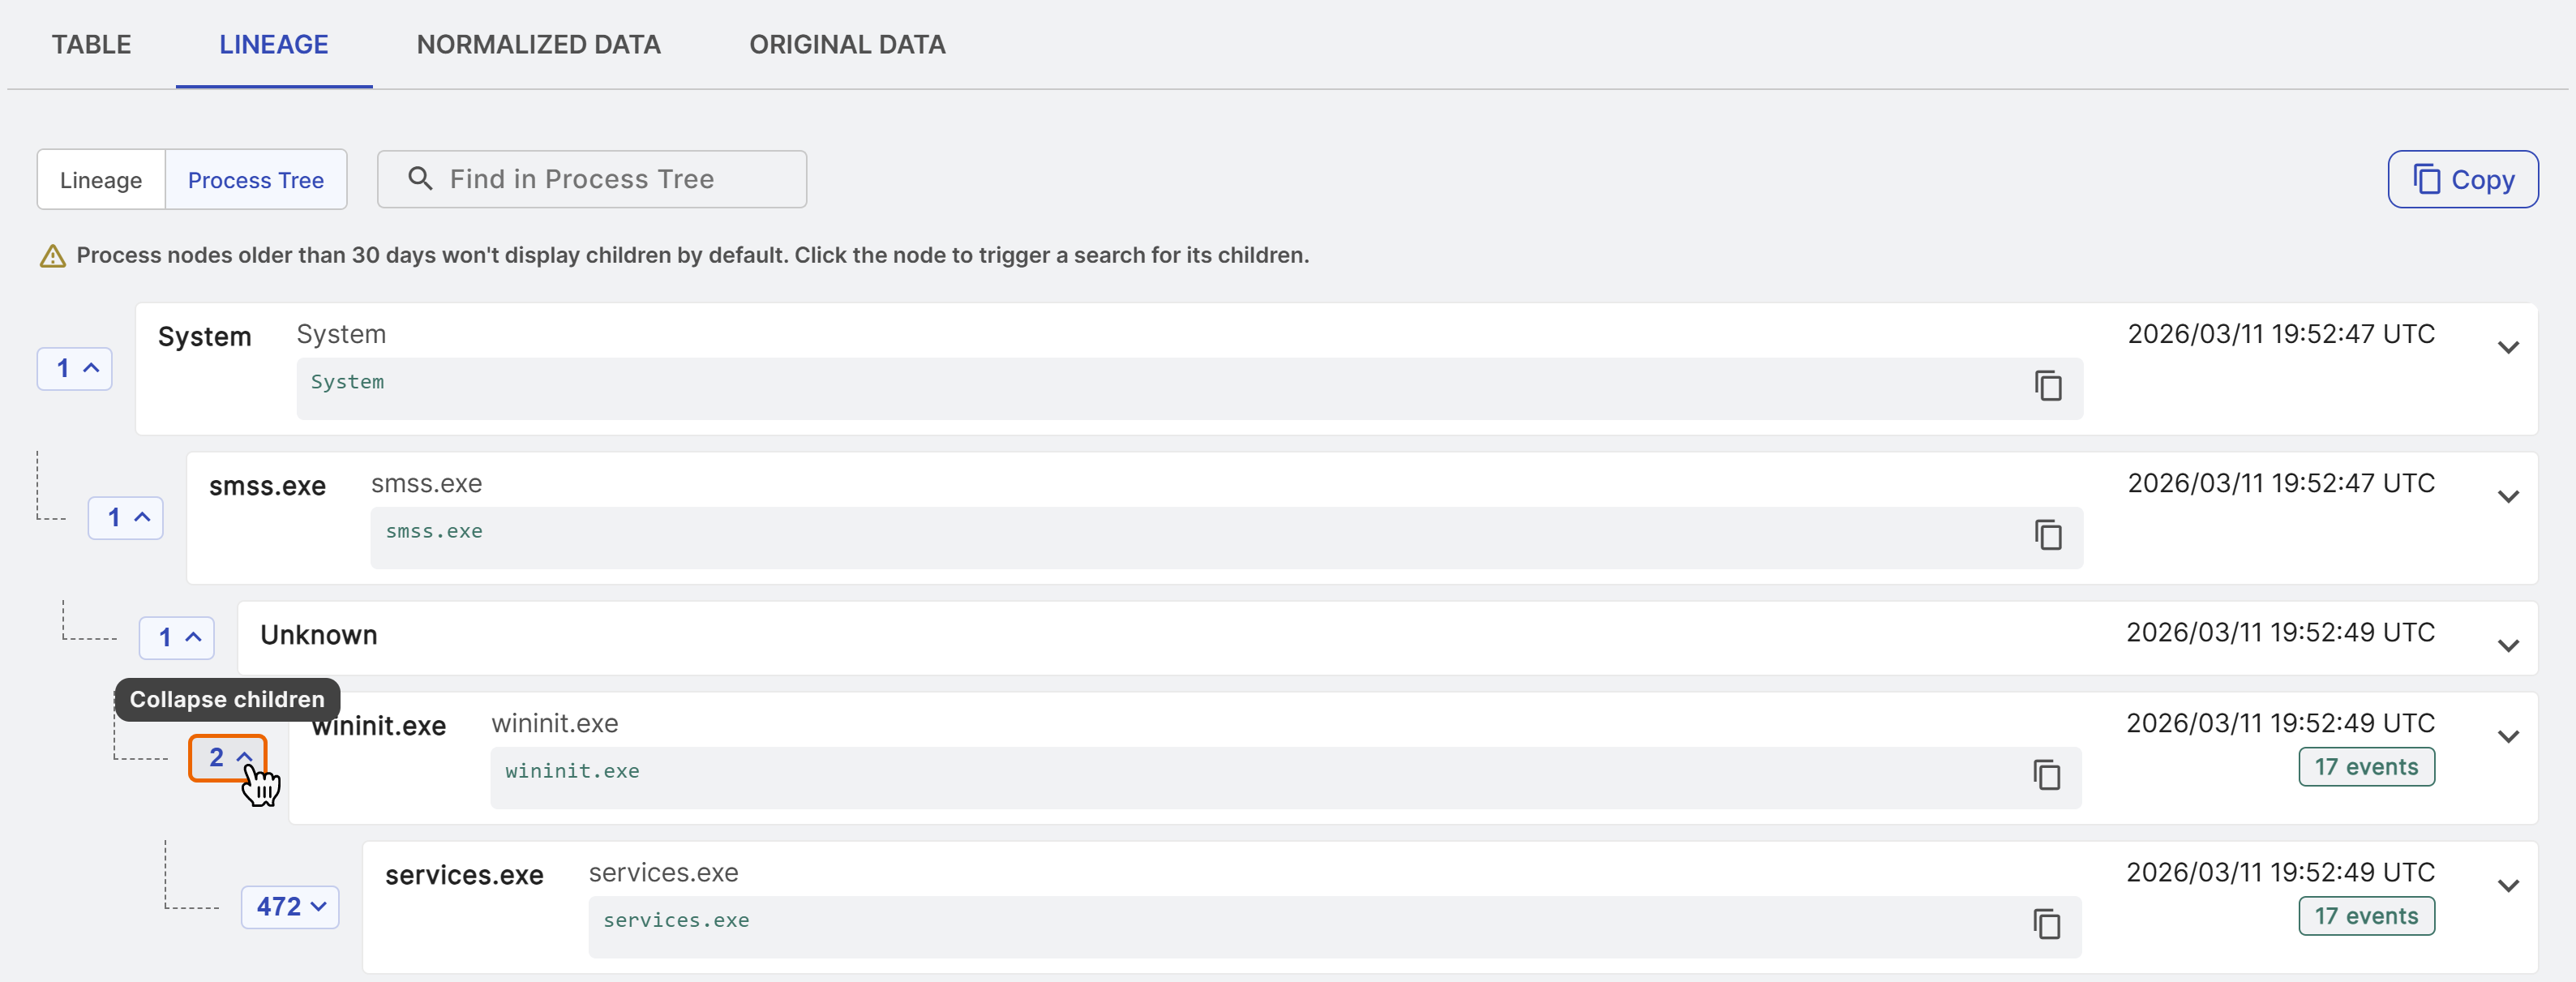
You can expand or collapse a process tree node to see or hide the children. To do so, click the number of children on the left of a node.
Tip
Click Reset to Default to return the process tree to its original state.
Search a process tree
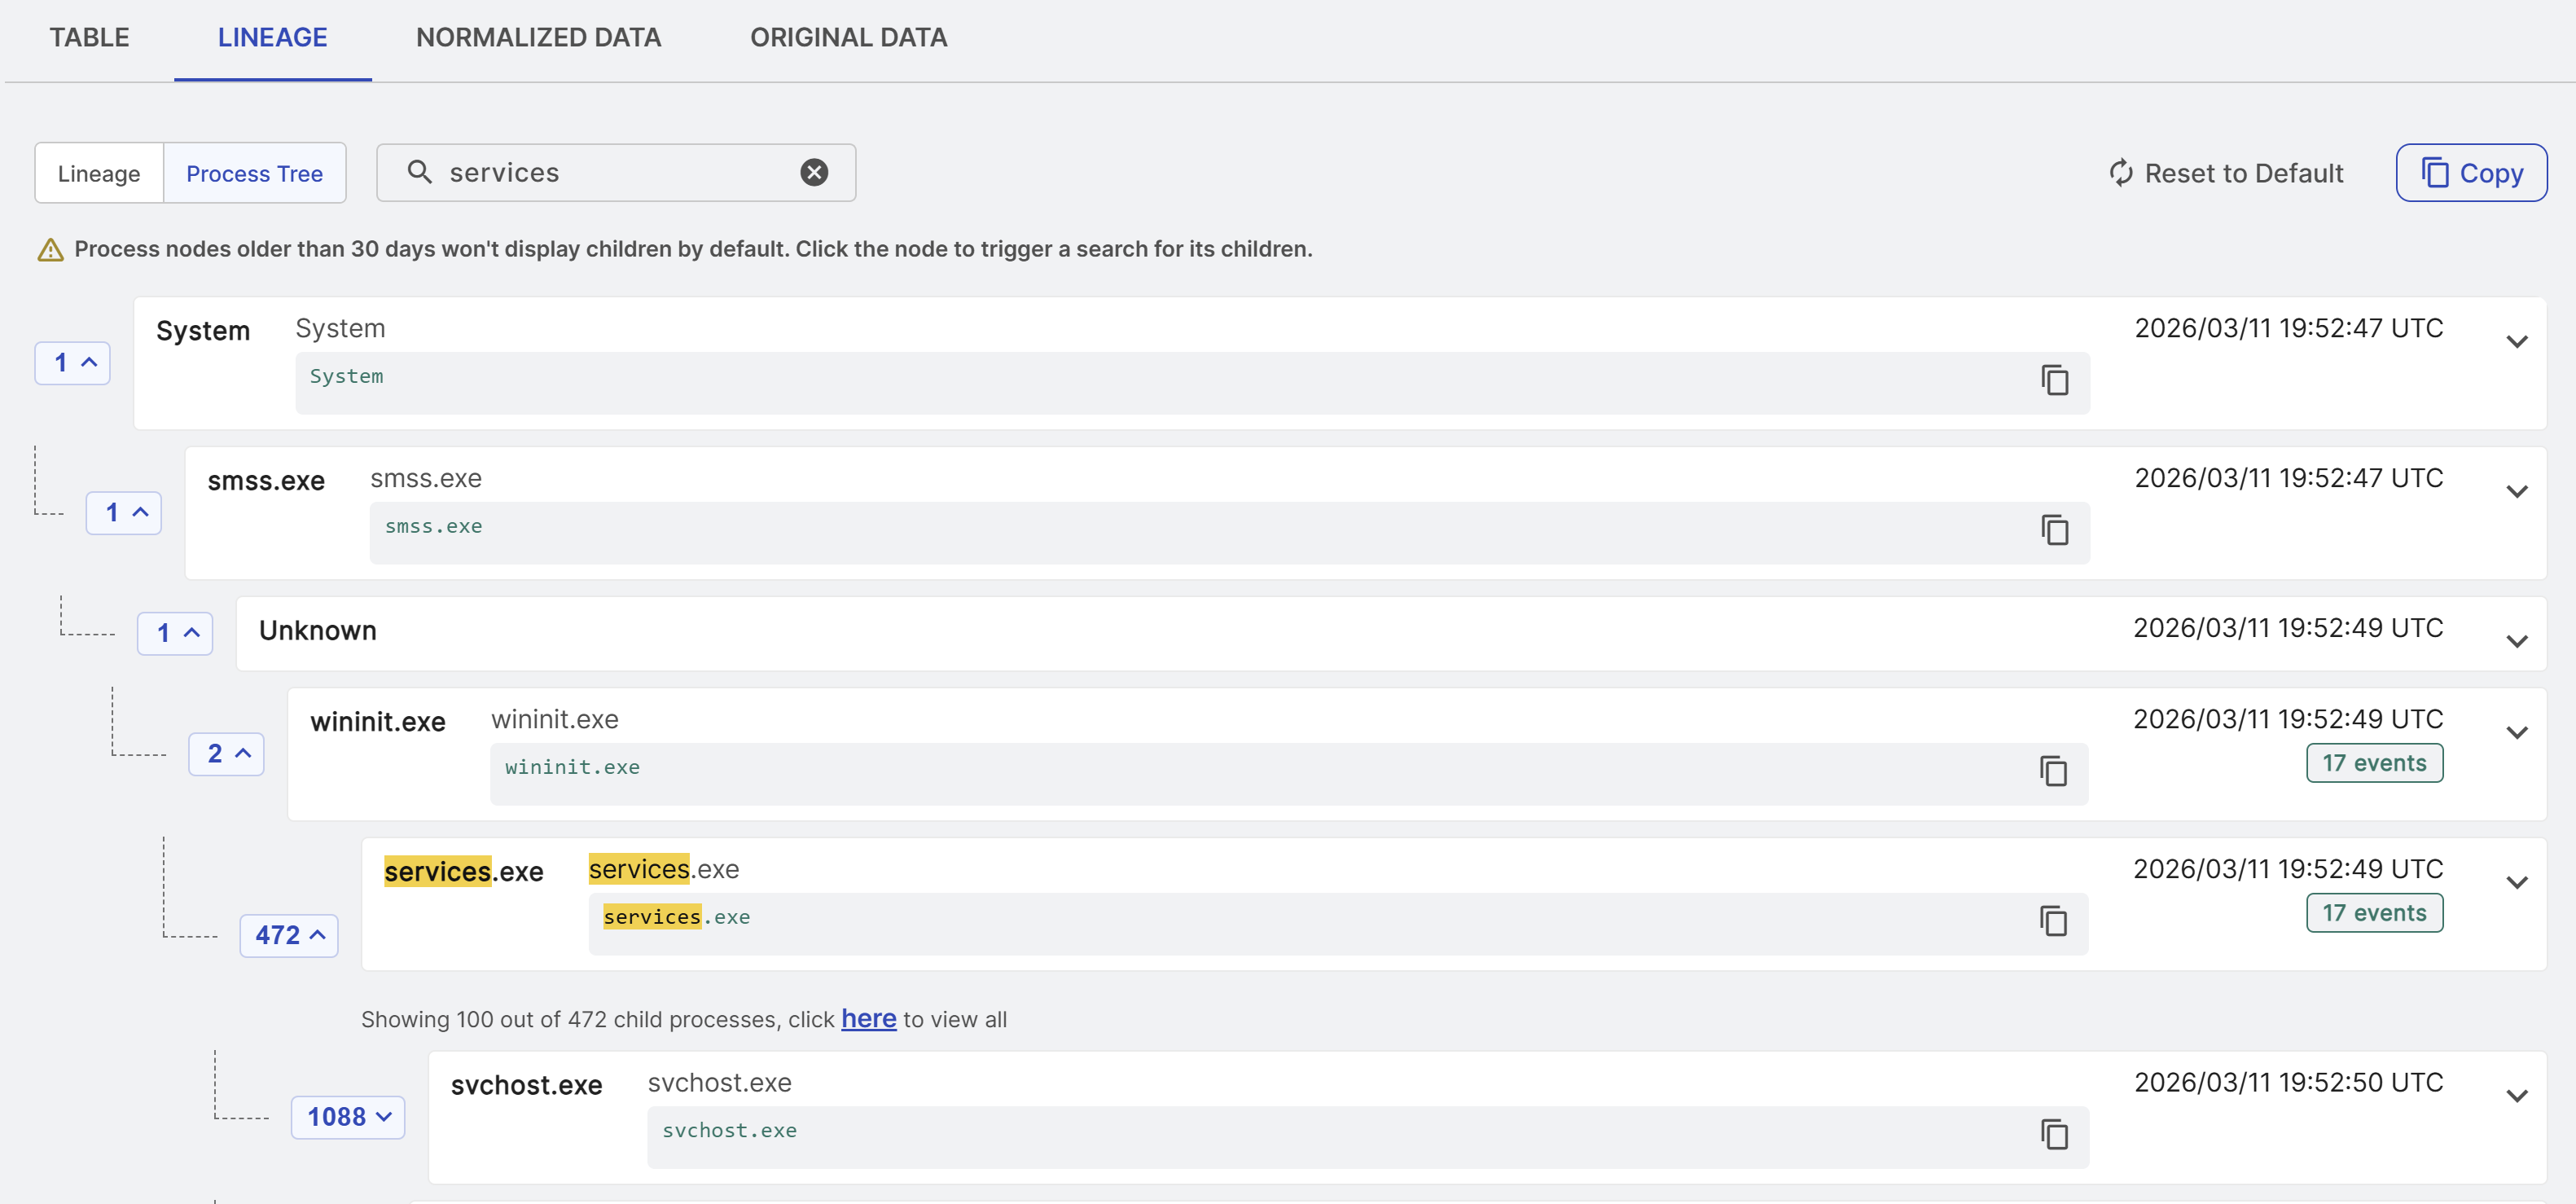
The Process Tree view contains a search feature. Identify nodes that contain a search string using the Find in Process Tree text box.
Search specific processes with the IN operator
Use the IN operator to search within specific processes instead of searching all loaded process tree data. Do as follows:
-
Enter
in:in the search box.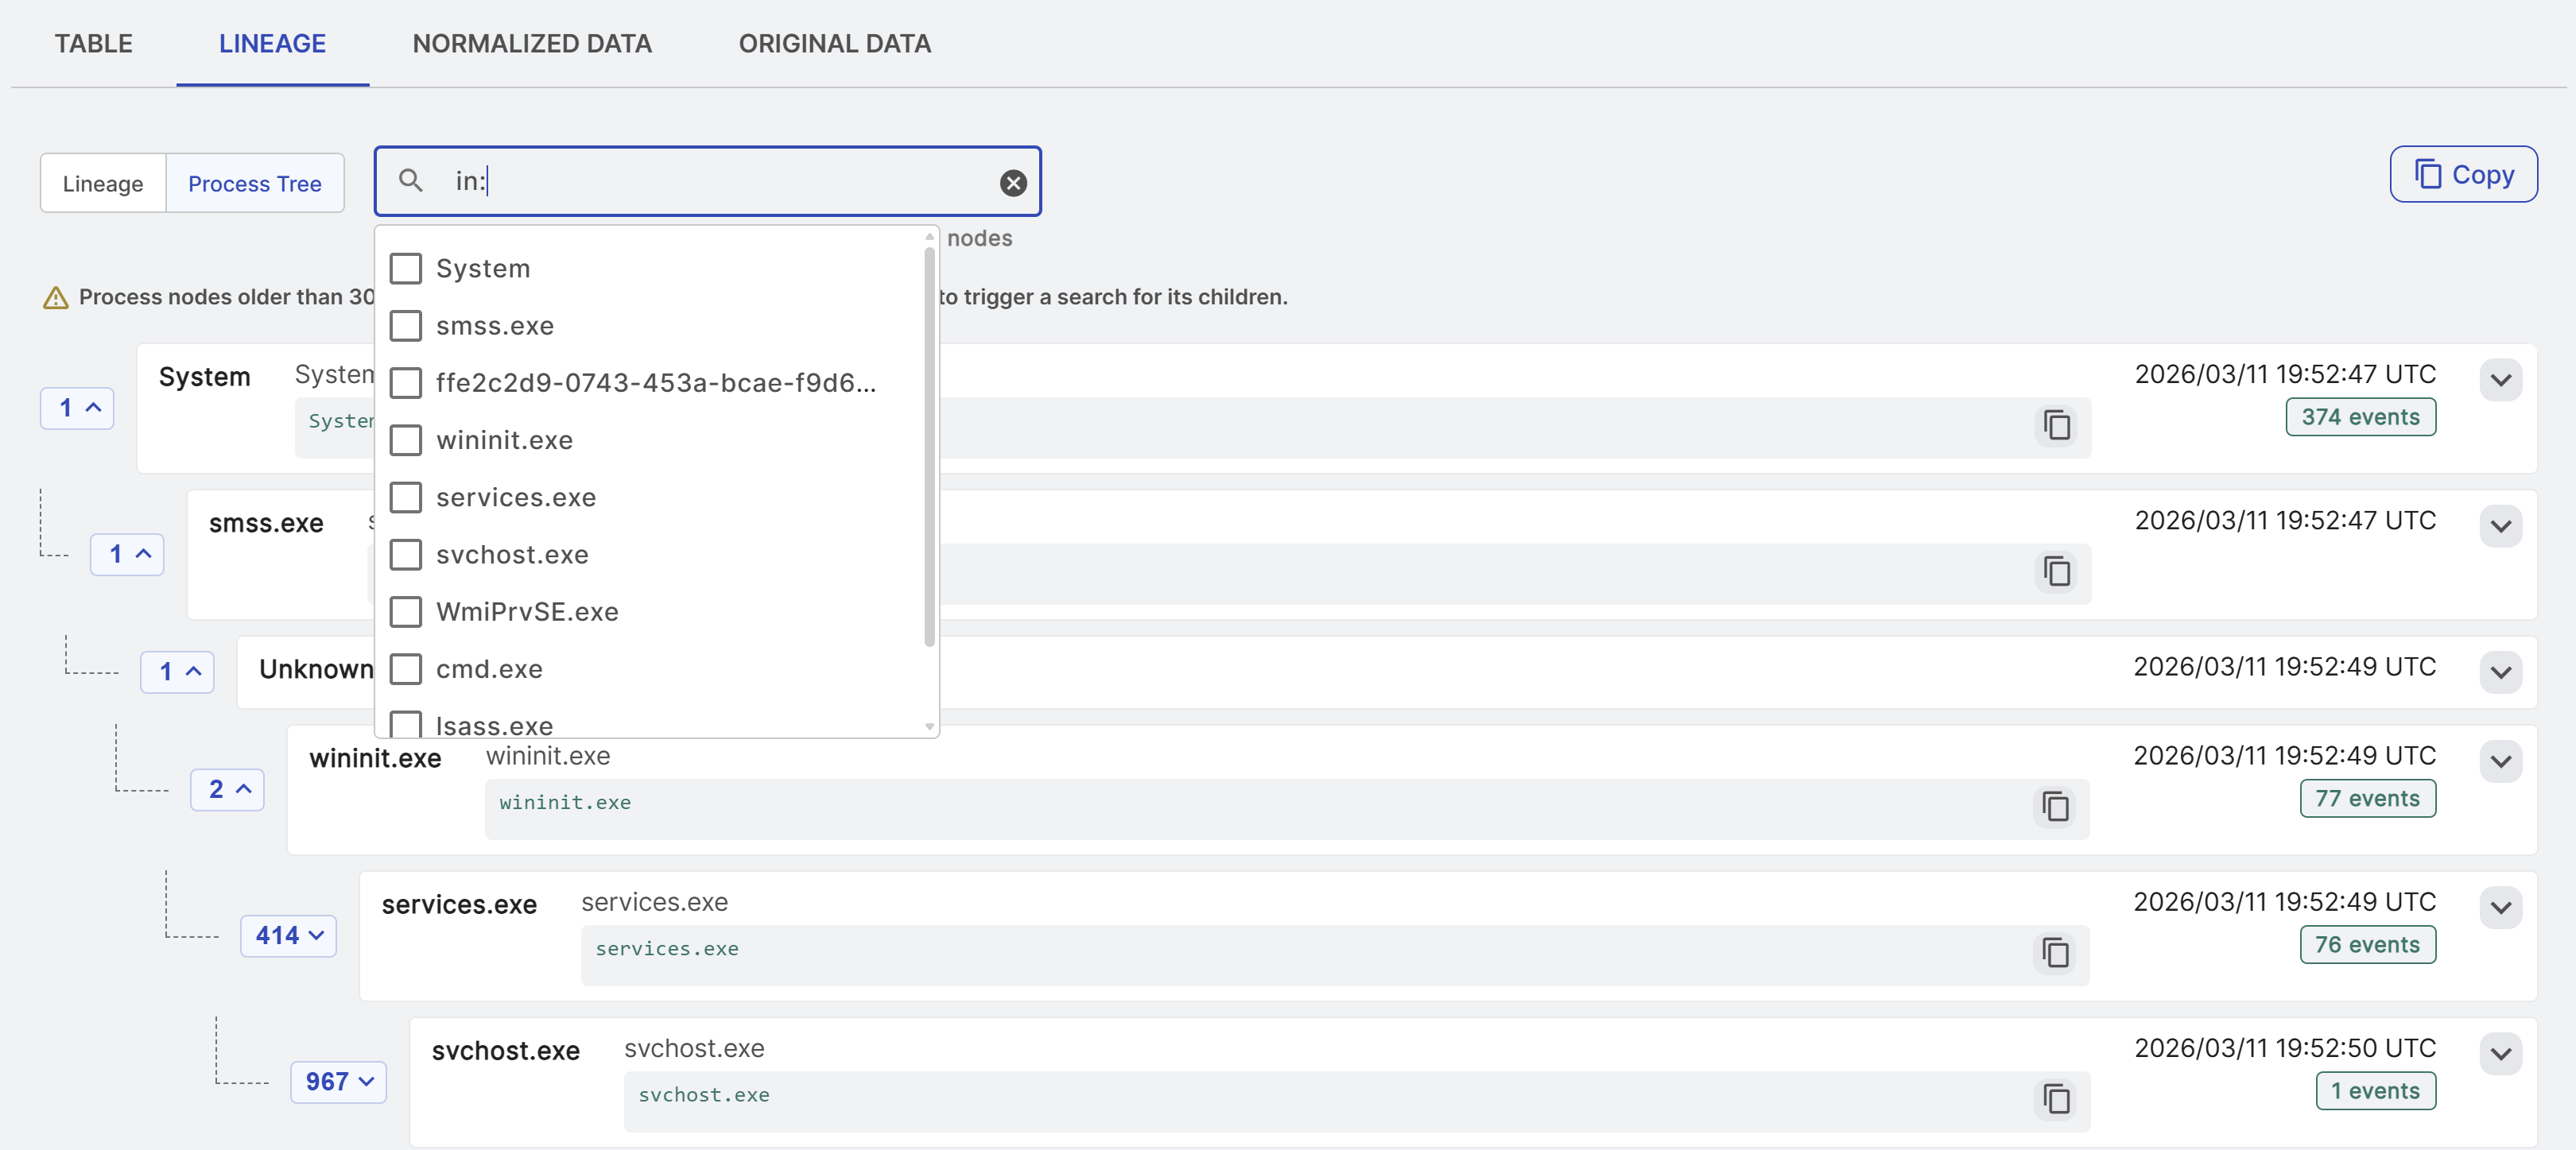
-
Select the processes you want to search.
-
Enter the search string.
Matching child processes are highlighted in the process tree.
View related detections and key activities
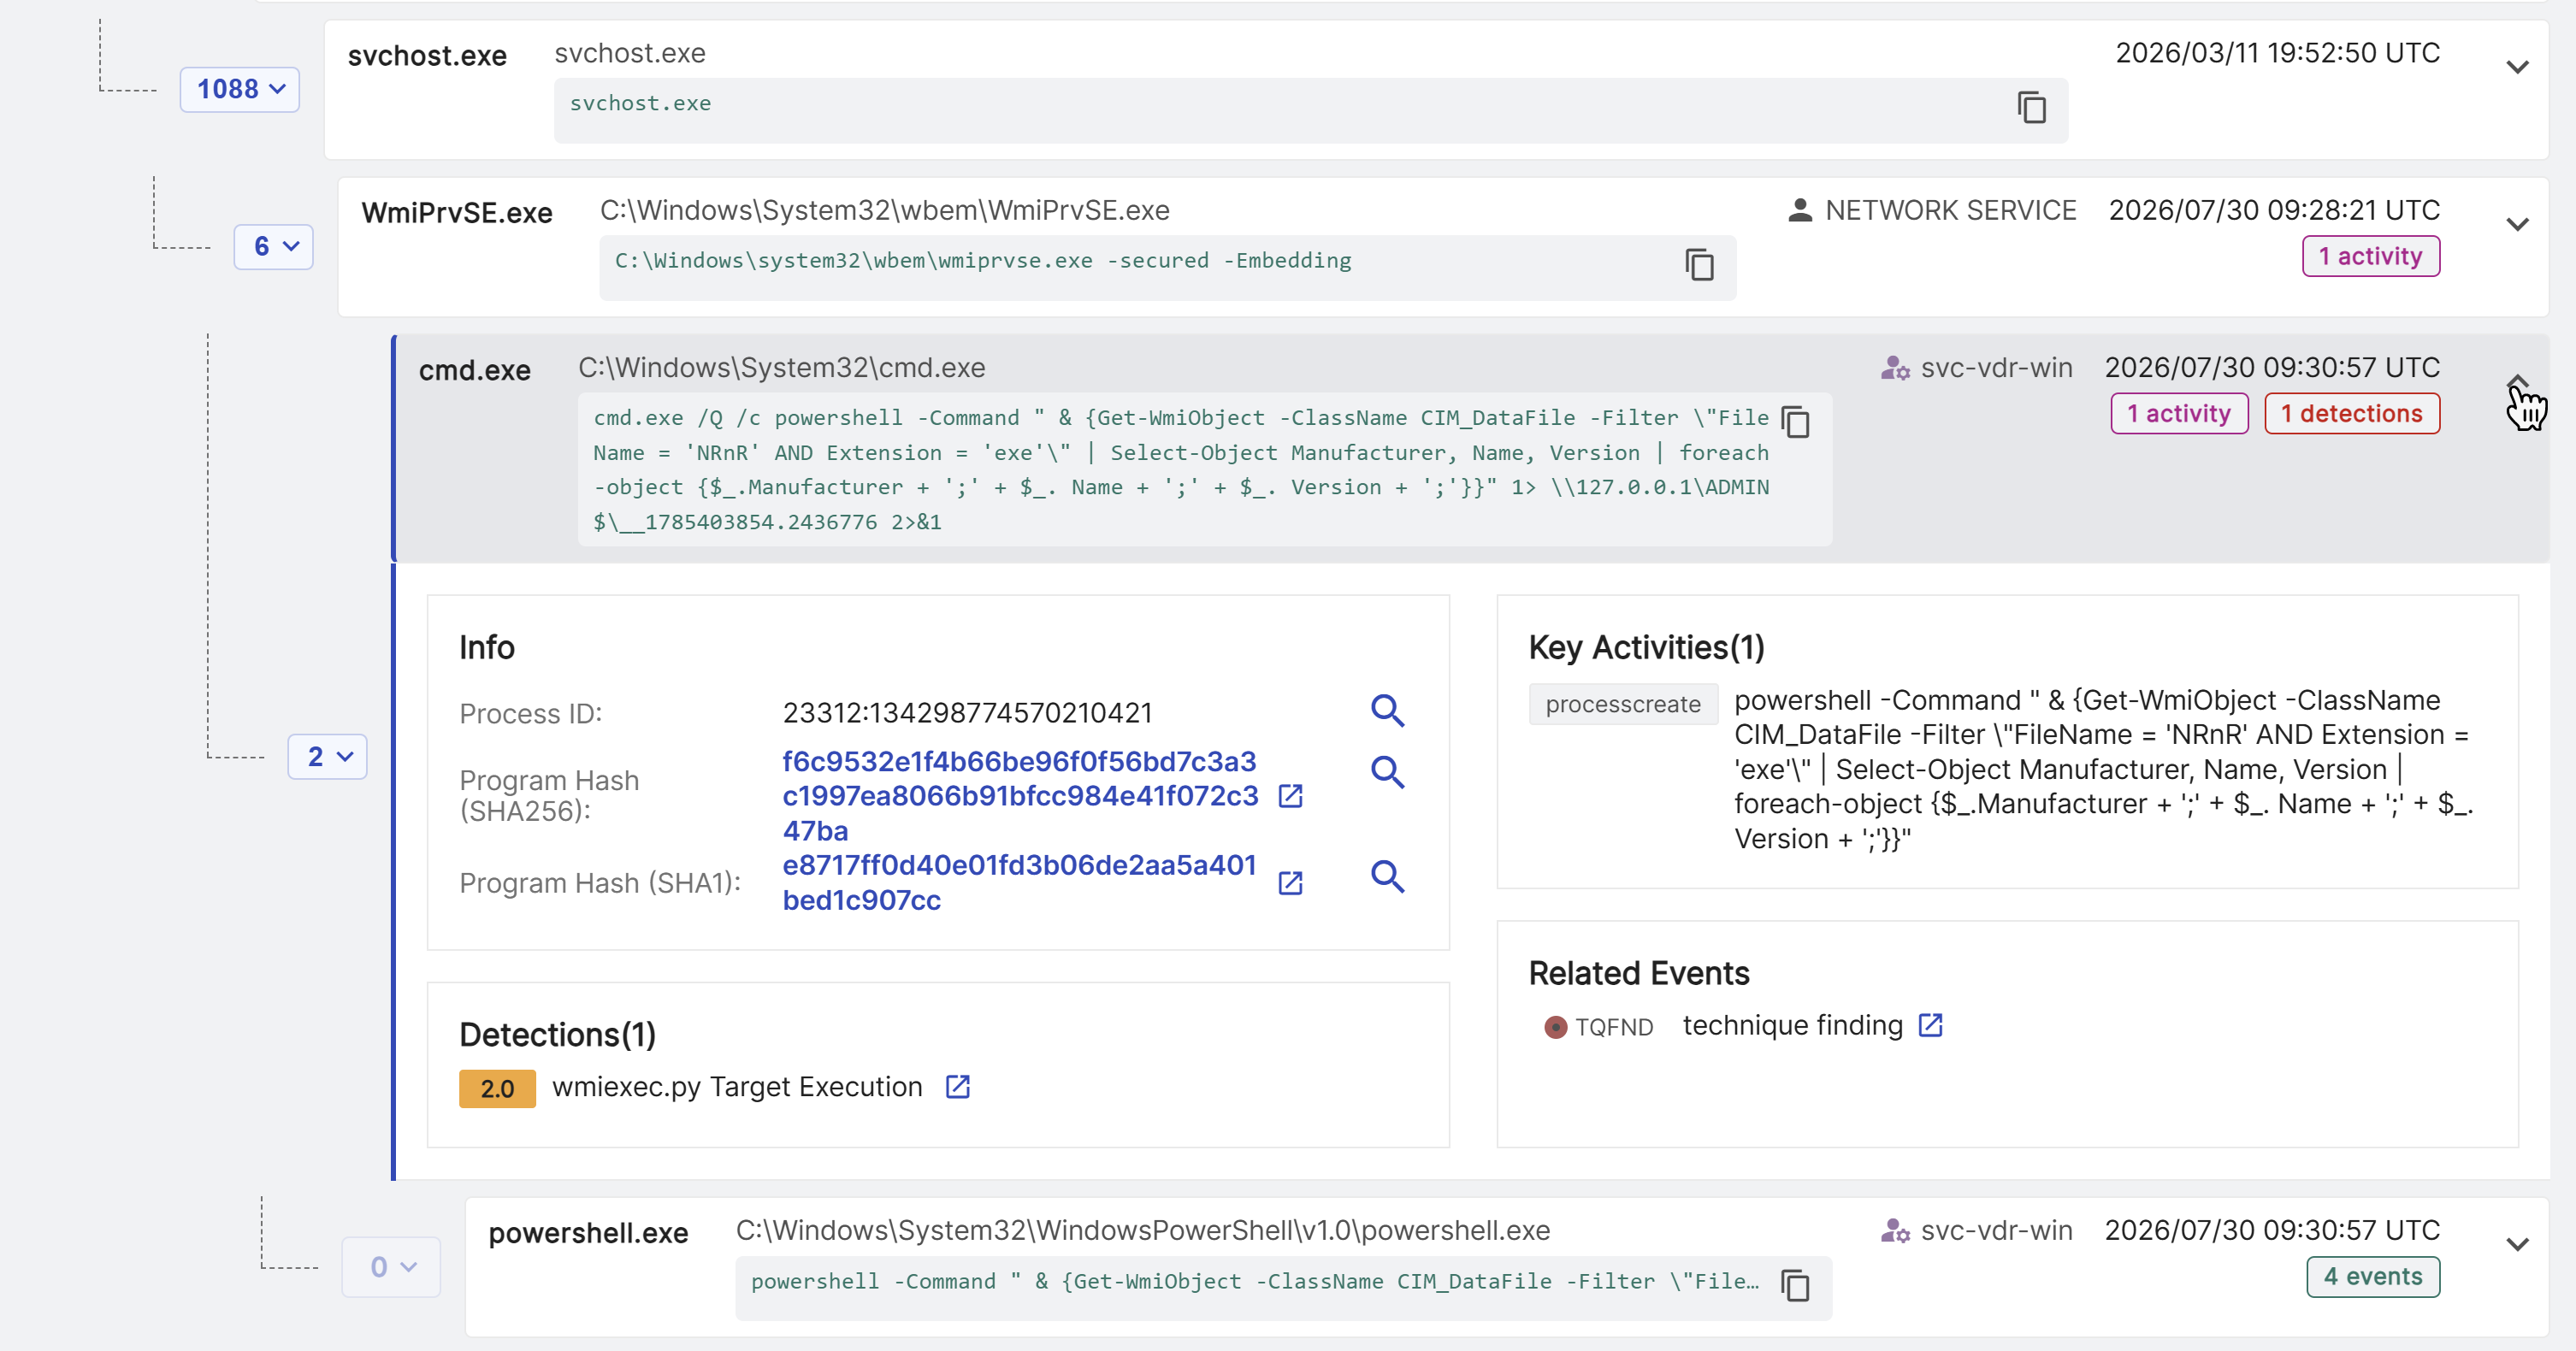
When detections are correlated with a process node, the detection is viewable in an expanded node.
For users with the Sophos Endpoint Agent, key activities are also visible in the process node.
Tip
Click the New Tab icon next to a detection to open it in a new tab.