Configured data sources
The Data Sources table lists each configured data source, including API integrations, syslogs, and Sophos products, and shows its log ingestion and normalization status. It also shows whether log messages are being received and which schema they map to after normalization. It sends data source–related email notifications as well.
To view this table, go to Security Operations > Integrations > Configured Data Sources.
Note
This page focuses on data flow and normalization from each source. For the health of the integrations themselves, see Configured integrations.
Tip
To export the full list of data sources, click Export All as CSV. To export a subset of the list, select the desired data sources, then click Export Selected as CSV. You can check the status of the export and download the file on the Data Exports page. See Data Exports for details.
Filter data sources
To filter the Data Sources table, start typing a data source name in the search bar, or use the collapsible filter menu to narrow down the list by fields, such as status, type, and ingestion point.
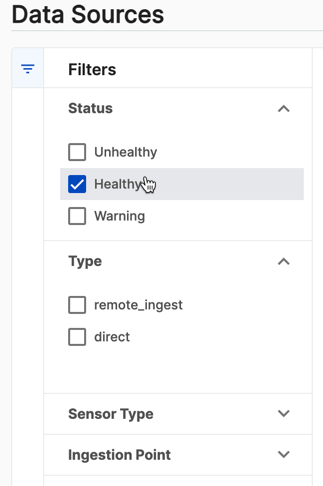
View data source health
The Data Sources table indicates the data source's logging health via the Status column. The status label is based on the amount of elapsed time since a log message was last seen from the device.
The health of a data source can be one of the following:
- Healthy: Last activity detected within one hour.
- Warning: Last activity detected between one hour and 24 hours ago.
- Unhealthy: No activity detected for more than 24 hours.
If a data source isn't in a Healthy state, make sure the device is online and can reach the integration, and then refer to the corresponding integration guide for the device type to ensure it's configured to log correctly. See Products.
View data source details
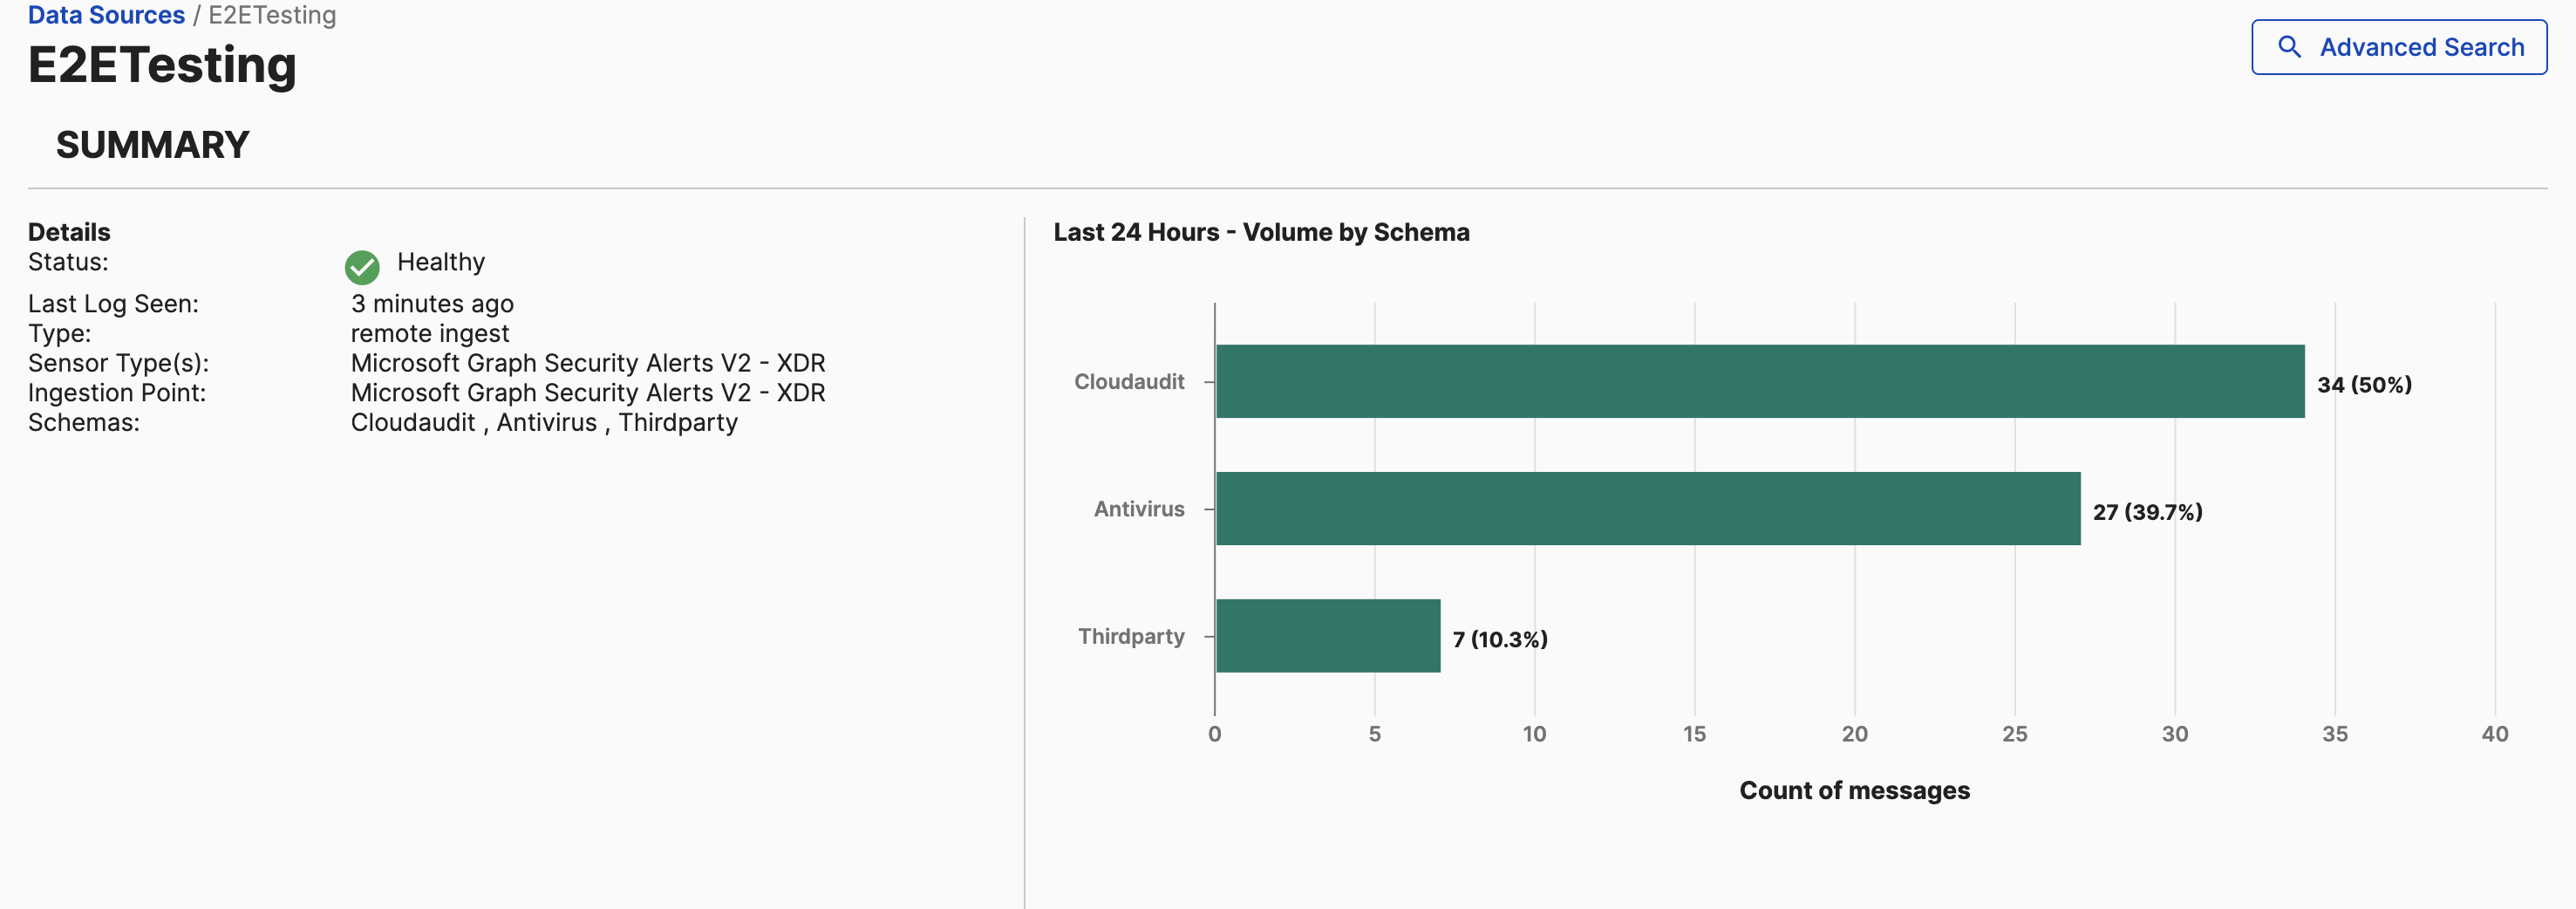
Click a data source's name in the table to view its details in a slide-out. Open them in a new tab by clicking the New Tab icon . The details page includes a summary of the data source's current status and other basic information. It also features a chart of its message volume by schema over the last 24 hours.
Pivot search from a data source
To run a pivot search from a data source, do as follows:
- Click a data source's name in the table to view its details in a slide-out.
-
Near the top of the slide-out, click Advanced Search.
A Data Lake Search opens in a new tab, pre-populated with a search on the data source's sensor ID for the past 24 hours, such as the following query:
ingest.integration_id = 'f627699c-6794-4d95-aa90-5653f252f103' EARLIEST =-24h
Delete a data source
Click the Trash icon to remove a data source's records from the table. This action can't be undone.
Note
The delete action deletes the device record, not the telemetry received from the data source. If a deleted data source continues to send telemetry to Sophos XDR, it'll reappear in the table. Deleted data sources may take up to five minutes to be fully removed from the table.