Overview dashboard
The XDR Overview dashboard provides a snapshot of your organization's security protection. To see the dashboard, go to Security Operations > Dashboard.
General dashboard widget settings and functionality
- Use the widget's drop-down date and time picker to change the period. The default selection is the last 30 days, but the most recently chosen period becomes the new default.
- Click a New Tab icon to open the widget's matching data in a new tab.
Widgets
The following widgets are available in the XDR Overview dashboard.
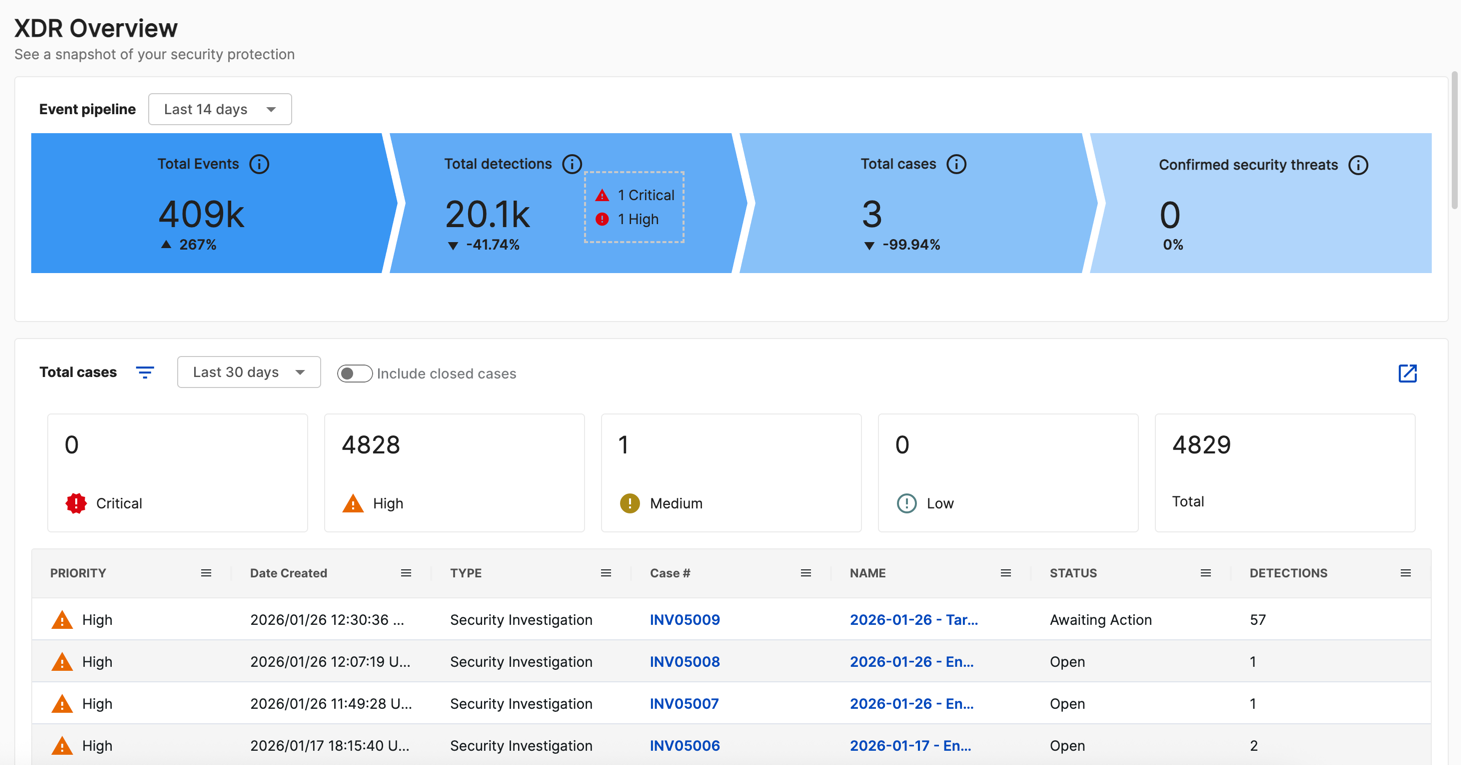
Event pipeline
How this helps
This widget shows a snapshot of how events are triaged and handled.

The Event pipeline widget depicts various stages of event filtering for the selected date range.
The pipeline includes the following metrics:
- Events: The number of raw events received from all sensor types.
- Total detections: The number of high- and critical-severity detections that were triggered from those events.
- Total cases: The number of cases that resulted from those detections.
- Confirmed security threats: The number of those cases that were resolved as true security incidents and mitigated.
Note
As part of the ingestion statistics, the number of raw events for the previous day is calculated daily starting at 08:30 UTC and is expected to be completed within a reasonable period. Due to this batch job, the Event pipeline widget doesn't include the number of raw events for the current day. If viewed before the batch job at 08:30 UTC, the number of events doesn't include the previous day either. Therefore, the Event pipeline widget data is based on a shorter date range than what is selected for the dashboard. For example, when a 7-day range is selected for the dashboard, and the dashboard is viewed at 07:30 UTC, the actual date range for the widget is five days, starting two days before the current day. The prior range is five days as well, so that the comparison between the current and prior ranges makes sense.
To align the date range for all metrics on the Event pipeline widget, the number of high and critical detections, open cases, and confirmed security threats follows the same logic to align the date range for all metrics on the Event Pipeline widget, ensuring an accurate and consistent pipeline flow.
Total cases
How this helps
This widget informs you of ongoing investigation into recent suspicious activity. You can click through multiple cases to easily browse important details.
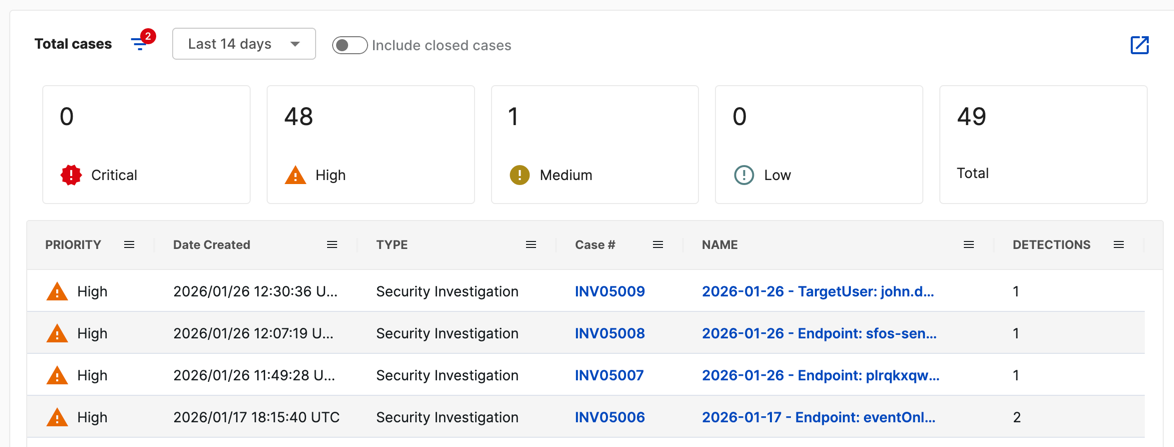
The Total cases widget shows a table of all cases within the selected time frame. Click a case number or name to browse cases in a slide-out, or open them in a new tab using the New Tab icon .
There are a few ways to filter this table:
- Closed cases are excluded by default. Turn on Include Closed Cases to include them.
- Filter cards above the table show the number of cases based on priority. Select one to refine the list.
-
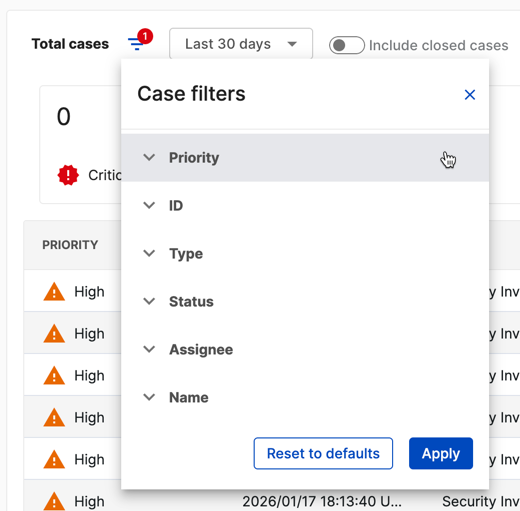
Open the Case filters menu to add or remove any filters, such as the case priority, ID, type, status, assignee, and name.
-
By default, the table is sorted by priority. Select any column header to reorder the list.
- Click and drag any column to move it.
- Click the Menu icon on any column to add, remove, autosize, or pin columns.
Total detections
How this helps
This widget helps you triage the latest detections, so you can determine if they should be investigated further.
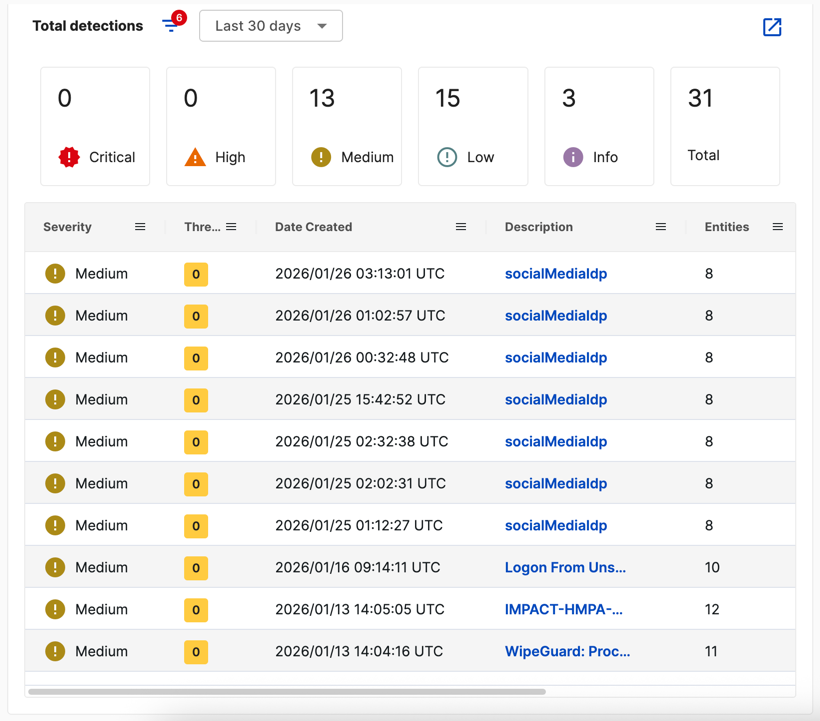
The Total detections widget shows a table of all detections within the selected time frame. Click a description to browse detections in a slide-out, or open them in a new tab using the New Tab icon .
There are a few ways to filter this table:
- Filter cards above the table show the number of detections based on severity. Select one to refine the list.
-
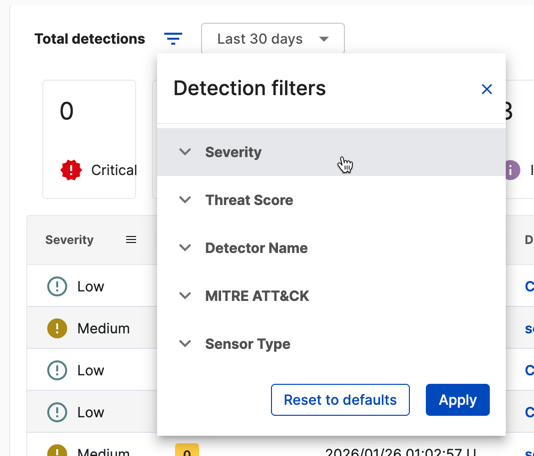
Open the Detection filters menu to add or remove any filters, such as the severity, threat score, detector name, MITRE ATT&CK category, and sensor type.
-
By default, the table is sorted by most recent detections. Select any column header to reorder the list.
- Click and drag any column to move it.
- Click the Menu icon on any column to add, remove, autosize, or pin columns.
Open case assignments
How this helps
This widget allows you to access your unresolved cases, so you can get back to your previous work, check in on an active case, or view all cases.
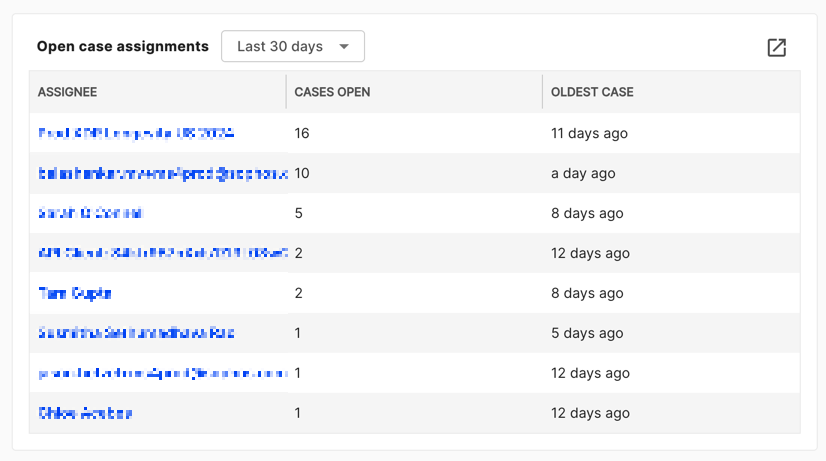
The Open case assignments widget shows which users have any case assigned to them that is currently open, active, or awaiting action. The table shows the assignee name, the number of open cases assigned to them, and the age of their oldest open case. Click their name to open a slide-out with more details and links to the open cases.
Detections MITRE ATT&CK heat map
How this helps
This widget helps you identify the most commonly observed MITRE ATT&CK techniques across all detections and allows for quick filtering of detections by technique.
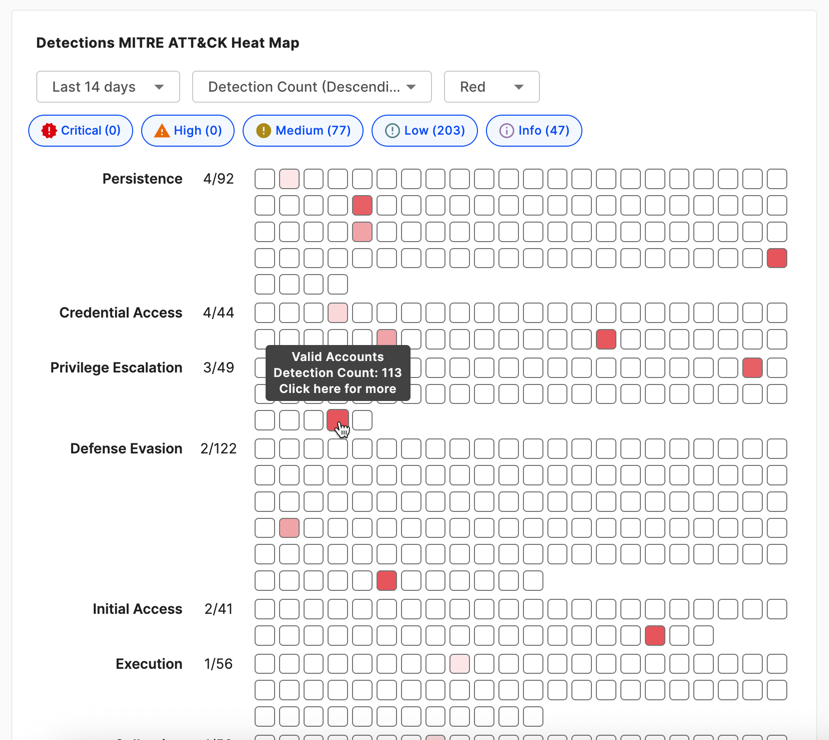
The Detections MITRE ATT&CK heatmap widget maps your detections to MITRE ATT&CK V9 Enterprise techniques. The heatmap depicts the volume of techniques observed in your environment. An empty cell indicates that the technique wasn't observed during the chosen time frame. A colored cell indicates the technique was observed, with increasing detection counts visualized with increasing color brightness.
Adjust the heatmap with the following filters:
- Select a detection severity filter chip from the top of the widget to remove or add detections of that severity to the heatmap.
- Sort the heatmap by detection count ascending or descending.
- Use the Color menu to change the color used in the heatmap.
Hover over a cell to view the technique name and detection count. Click a cell to open a slide-out with a table of the underlying detections. When viewing this table, open the Detection filters menu to add or remove any filters, such as the severity, detection name, and sensor type.
Total cases over time
How this helps
This widget helps you pinpoint any abnormal spikes or deficits in case handling over a period of time.
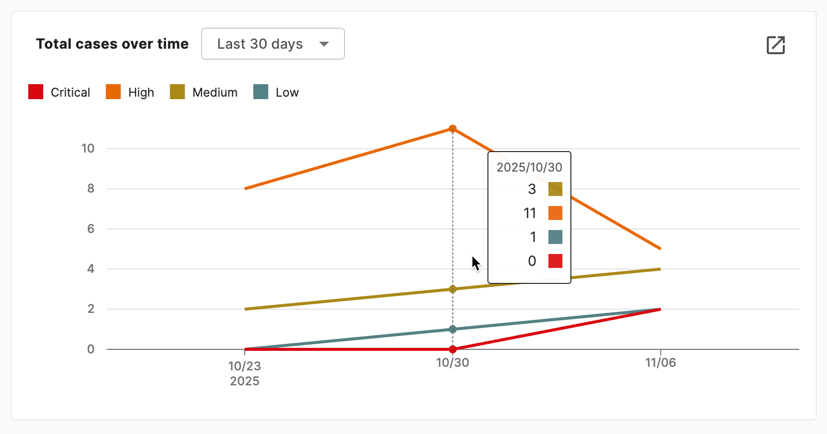
The Total cases over time widget shows a color-coded timeline view of cases by priority for the selected time frame. Hover over a line to see the count of cases on that date. Click the filter chips to highlight certain priorities over others.
Total detections over time
How this helps
This widget depicts trends in detection creation, so you can recognize abnormal spikes or deficits in detection activity.
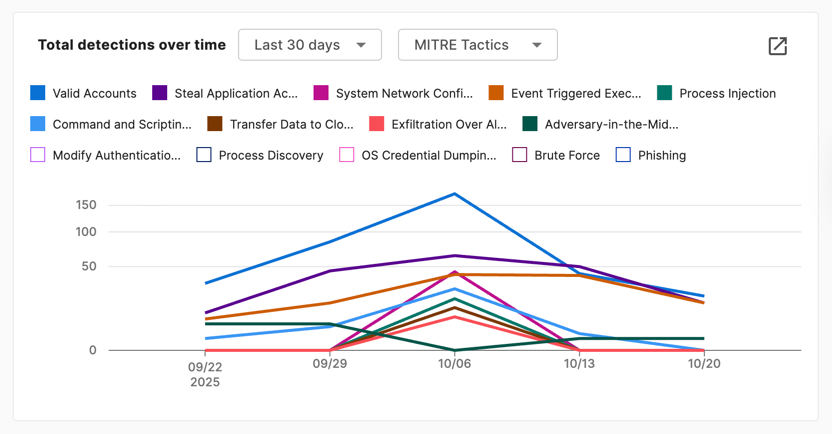
The Total detections over time widget shows a color-coded timeline view of detections based on various detection categories. Use the drop-down menu to select the category type you want to view, MITRE Tactics or Severity. Customize your view by clicking filter chips to narrow down the categories depicted in the chart. Hover over a line to see the count of matching detections on that date.
Detection flow
How this helps
This interactive widget lets you see the frequency of detection data, plus explore and analyze the connections between each category. For example, you can analyze how many detections with high threat scores of 8-10 end up with a particular status, or how many detections generated by a specific detector result in a particular threat score.
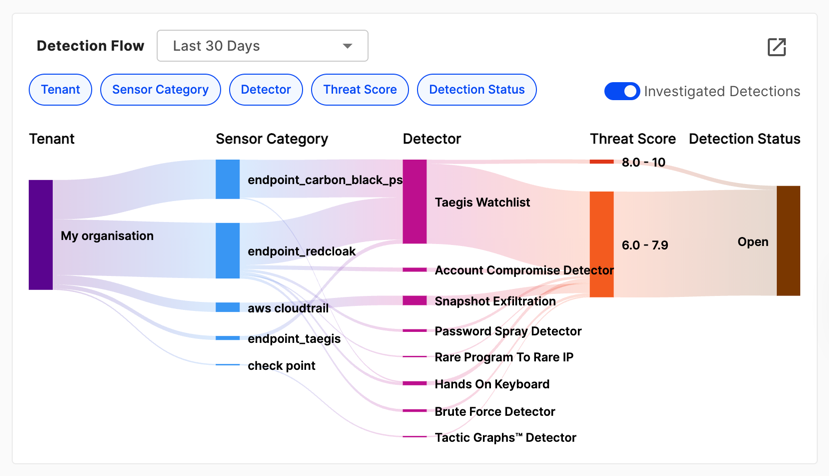
The Detection Flow widget aggregates detection data from your environment to visualize the frequencies of various categorical data and how these categories connect. The available categories are Time, Sensor Category, Detector, Threat Score, and Detection Status. Select a filter chip from the top of the widget to remove or add that column in the visualization. Hover over a node or the path between nodes to view the count of applicable detections.
By default, only detections that have been added to a case for investigation are included in the diagram. To restrict it to only detections that haven't been added to a case, turn off the Investigated Detections option.