SD-WAN performance
You can see graphs showing the real-time performance of the gateways in your SD-WAN network.
To monitor the real-time performance of the gateways, go to Diagnostics > SD-WAN performance and select an SD-WAN profile.
Alternatively, go to Routing > SD-WAN profiles, select an SD-WAN profile, and under Status, click Historical performance.
You can see graphs for latency, jitter, and packet loss for each gateway in the SD-WAN profile. You can filter the graphs by time (Live, 24h, 48h, Week, or Month).
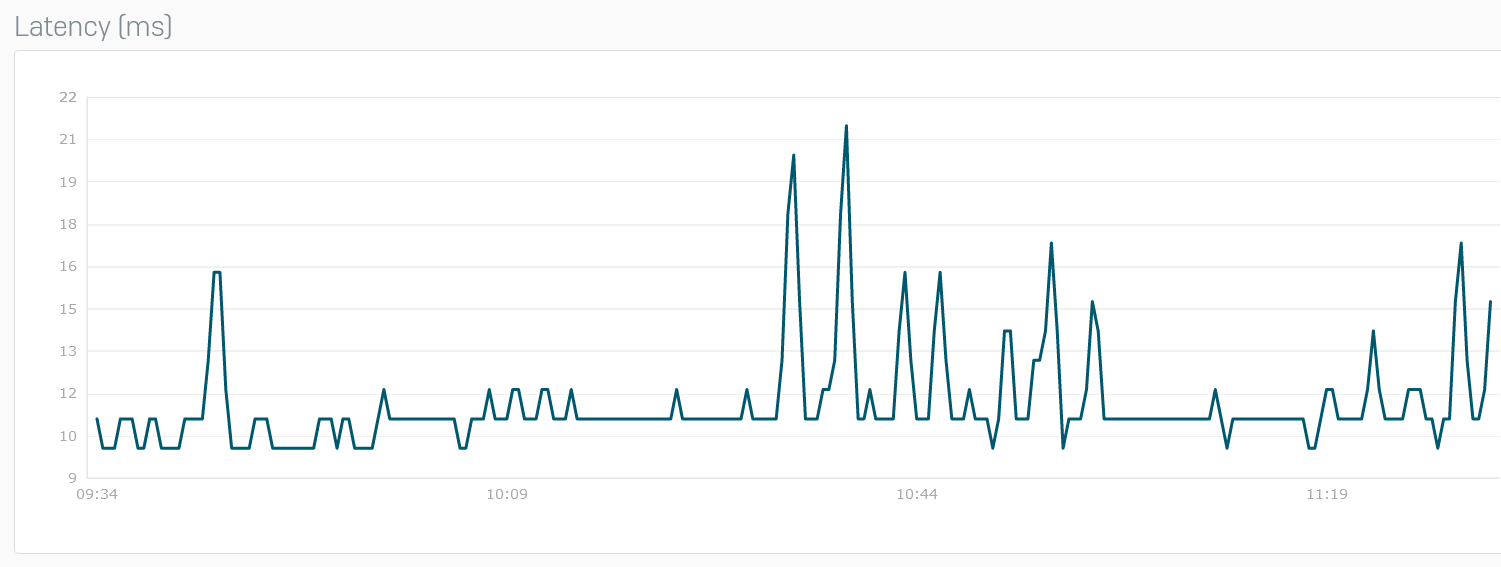
Latency
The x-axis shows time.
The y-axis shows the latency in milliseconds.
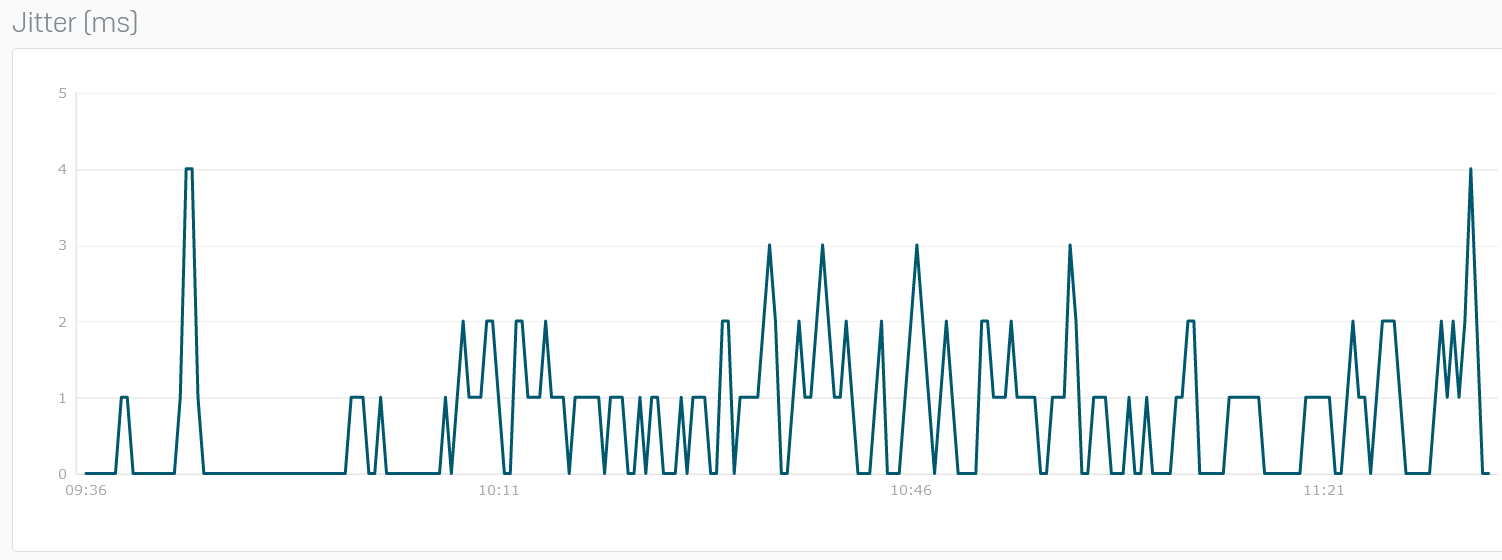
Jitter
The x-axis shows time.
The y-axis shows the jitter in milliseconds.
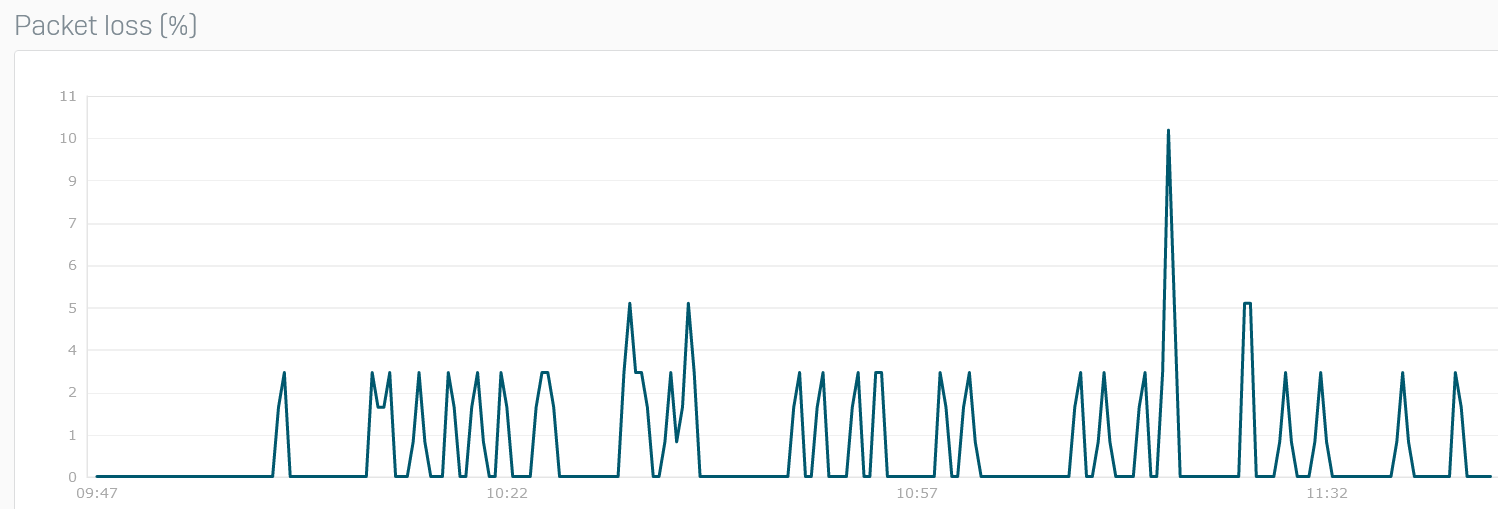
Packet loss
The x-axis shows time.
The y-axis shows packet loss in percentage points.