Disk usage graphs
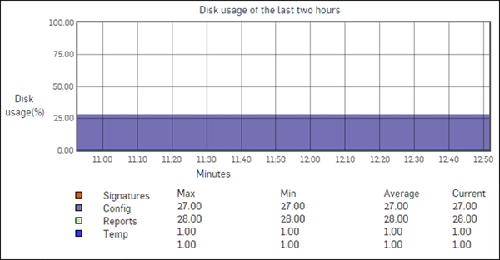
The Disk usage graph shows the percentage of disk use on your Sophos Firewall.
The x-axis shows minutes, hours, days, or months (depending on the time period selected).
The y-axis shows the percentage of disk use.
Legend
- Orange: Disk space used by signatures.
- Purple: Disk space used by the configuration files.
- Green: Disk space used by reports.
- Blue: Temporary disk space used.
