System
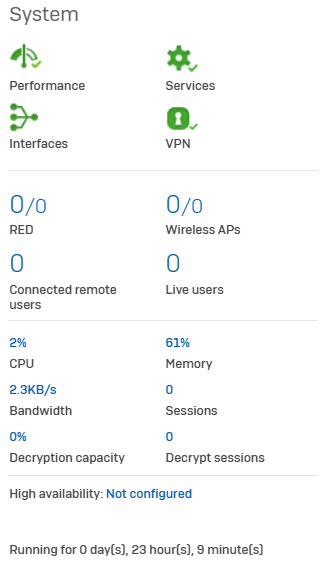
The System widget shows the real-time status of Sophos Firewall performance, services, WAN links and interfaces, and VPN connections, as well as the number of days since the firewall last started. The status is shown as an icon. Colored icons are used to differentiate statuses. Click an icon to see more detailed information.
System status widgets
The first group of widgets show the status of the CPU performance, services, WAN links, and VPN connections.
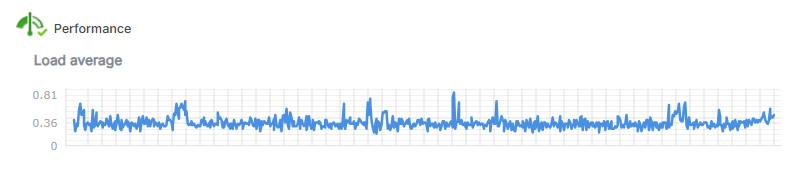
Performance
Performance shows the average load on the firewall's CPU cores using the following icons:
 Normal: The load average is less than 2 cores.
 Warning: The load average is from 2 to 5 cores.
 Alert: The load average is more than 5 cores.
 Unknown: The firewall's performance status is unknown.
Click the icon to see the load average graph, which shows the load average over the past week.
Note
Any number greater than the number of processor cores in the system indicates that, during that time, there was more work to do than the system was capable of doing.
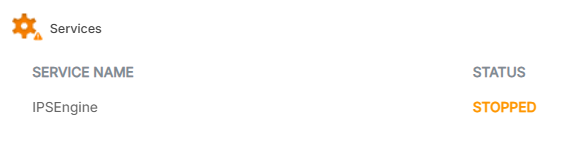
Services
Services shows the status of the firewall's services using the following icons:
 Normal: All the services are running.
 Warning: One or more services have stopped. Go to System services > Services to restart the services.
 Alert: One or more services failed to start. Go to System services > Services to restart the services.
 Unknown: The firewall's service status is unknown.
Click the icon to see any services that are causing a warning or alert status.
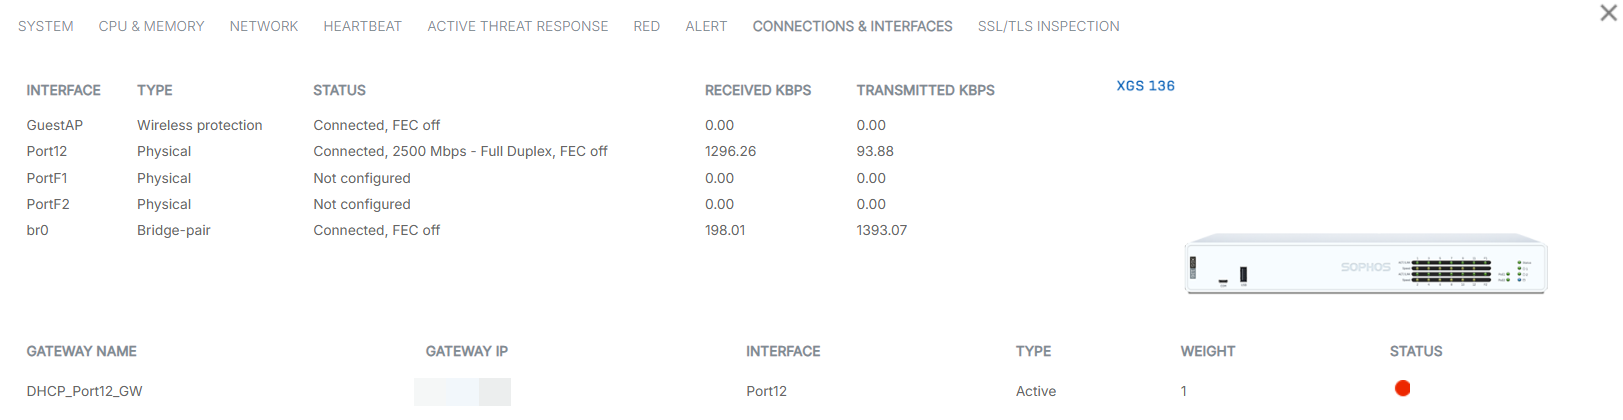
Interfaces
Interfaces shows the status of the firewall's WAN links using the following icons:
 Normal: All WAN links and interfaces are up.
 Warning: Up to half of the firewall's WAN links are down.
 Alert: More than half of the firewall's WAN links are down.
 Unknown: The status of the firewall's WAN links are unknown.
Click the icon to see details of the WAN links and interfaces.
Note
Ports without an IP address assigned to them have a red status. Example: Ports assigned to VLAN interfaces.
VPN
VPN shows the status of the firewall's VPN connections using the following icons:
 Normal: All of the VPN connections are up.
 Warning: Up to half of the firewall's VPN connections are down.
 Alert: More than half of the firewall's VPN connections are down.
 Unknown: The status of the firewall's VPN connections are unknown.
Click the icon to see details of the VPN tunnels.
Connection status widgets
You can also see the status of connected RED tunnels, wireless access points, connected remote users, and live users.
RED
The RED widget shows the number of RED tunnels established and the total number of RED tunnels configured. For example, "2/3" means two RED tunnels are connected out of a total of three configured tunnels. Click the widget to view a list of RED tunnels and configure RED.
Wireless APs
The Wireless APs widget shows active access points and the total number of access points configured. For example, "2/3" means two active access points out of a total of three access points. Pending access points, if any, will be shown separately in a bracket in red color. Click the widget to go to Wireless > Access points.
Connected remote users
The Connected remote users widget shows the total number of users connected remotely through SSL VPN. Click the widget to go to Current activities > Remote users.
Live users
The Live users widget shows the total number of live users. Click the widget to go to Current activities > Live users.
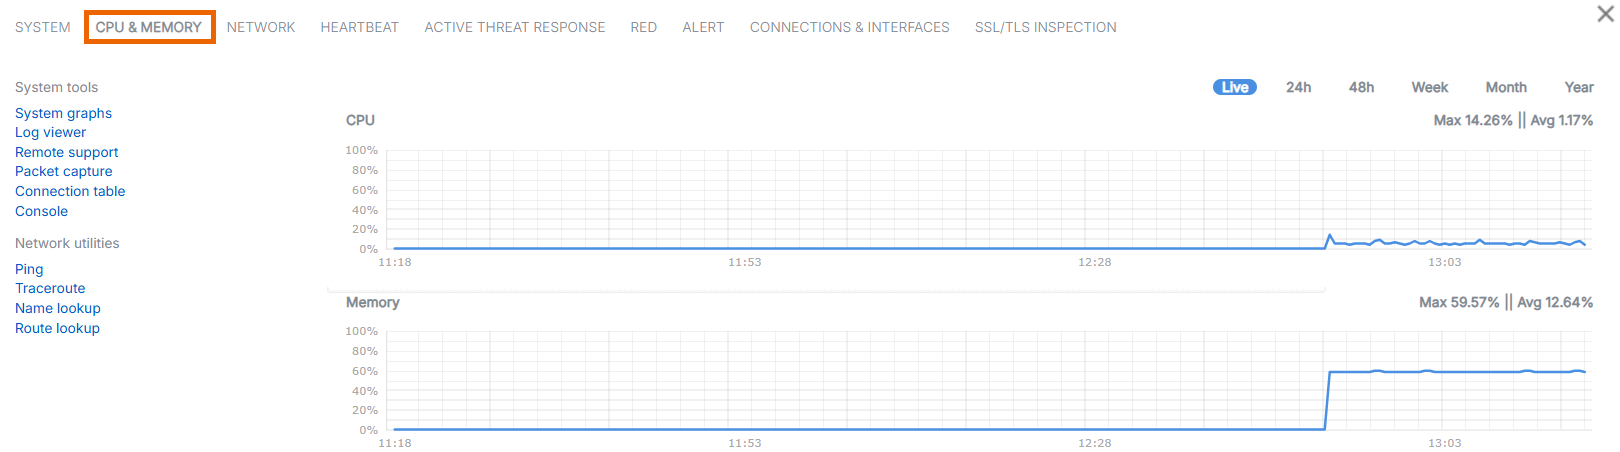
Performance counters
Below the widgets, you can see the following performance counters:
- CPU: Shows the CPU usage by users and system components.
- Memory: Shows the memory usage as a percentage.
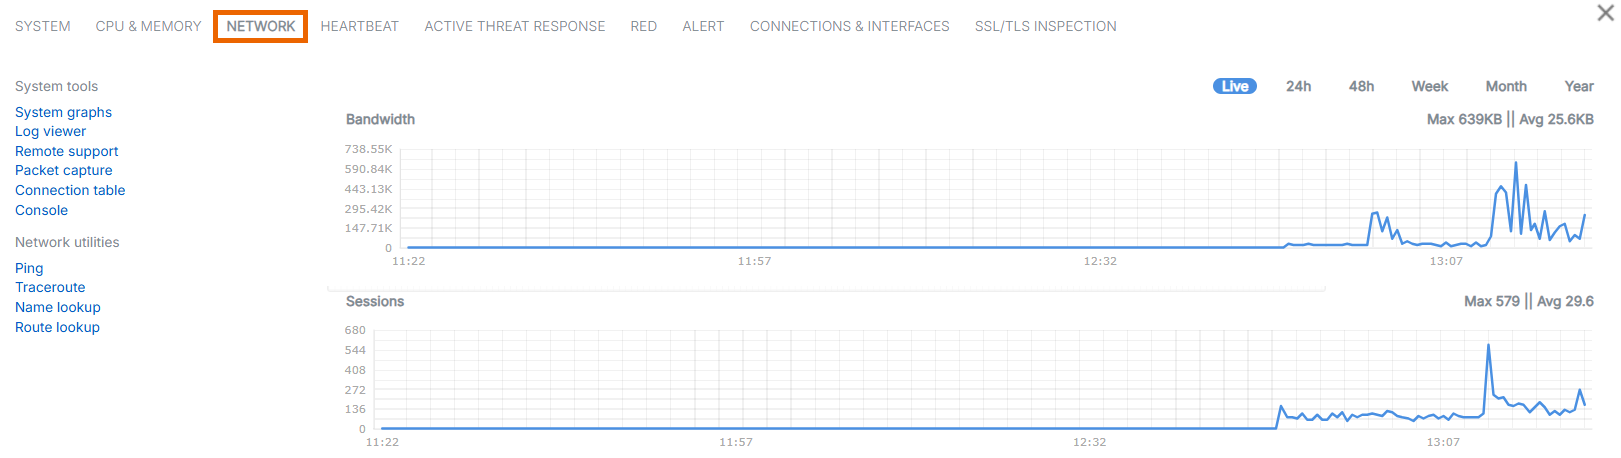
- Bandwidth: Shows the data transfer rate through the WAN zone.
- Sessions: Shows the total number of current sessions on the firewall.
- Decryption capacity: Shows the percentage of your firewall's total decryption capacity used by the current decrypted SSL/TLS connections.
-
Decrypt sessions: Shows the total number of decrypted SSL/TLS connections.
Note
Decryption details are updated every five minutes.
You can see a graph of the performance counters in the expanded system view on the CPU & Memory and Network tabs.
System configuration
The control center's System widget also shows the status of the following system configurations and the firewall's uptime:
- High Availability: Shows the firewall's High Availability (HA) status. Click to go to System services > High availability.
-
Managed by Sophos Central: You see this message if the firewall is managed by Sophos Central. Hover over the message to see the following details:
- Account: The name of the Sophos Central account managing the firewall.
- Email: The email address associated with the Account.
- Managed since: The day the firewall was added to the Sophos Central account.
- Joining method: The method by which the firewall was added to Sophos Central.