User & device insights
The User & device insights widget shows information about Security Heartbeat, Threat intelligence, User Threat Quotient, SSL/TLS connections, and Firewall sessions.
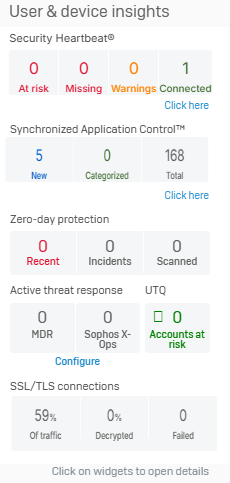
Security Heartbeat
The Security Heartbeat widget shows the health status of connected endpoint devices protected by Sophos. The endpoints send heartbeat signals at regular intervals, informing the firewall about potential threats. Endpoint health is shown using the following statuses:
- At risk (Red): Active malware is detected.
- Missing (Red): Endpoints are connected and generating network traffic, but aren't sending health status information.
- Warning (Yellow): Inactive malware is detected or malware was detected and cleaned up.
-
Connected (Green): No malware is detected and the endpoint is healthy.
Note
If endpoints showing a "missing" heartbeat status leave the network, the firewall will continue to show this status in the control center and in reports. The status only changes when these endpoints reconnect to the network. You can remove the "missing" heartbeat status of such endpoints from the control center and reports by using a command-line interface (CLI) command. For more information, see synchronized-security.
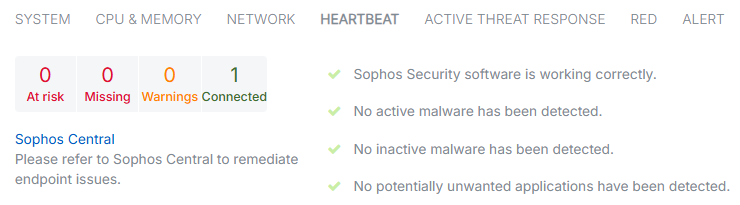
When you configure Security Heartbeat, it classifies endpoints into one of the four statuses. The Security Heartbeat widget shows the total number of endpoints for each status.
Click the widget to see a detailed view of all endpoints with a red or yellow status. For each endpoint, you can see the hostname, IP address, user, and the time since the status changed. You can filter endpoints based on their health status.
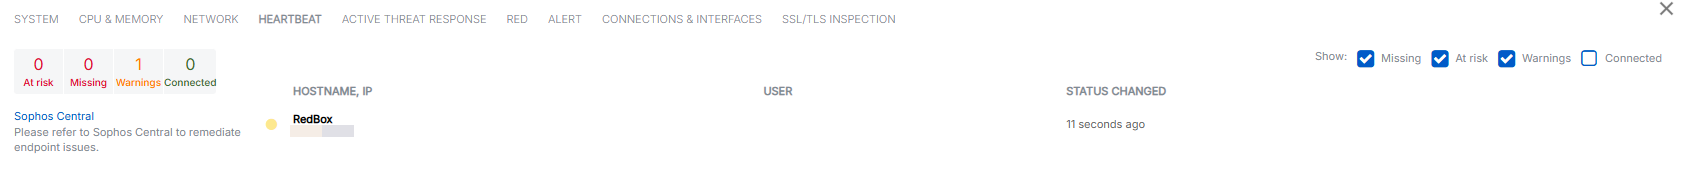
The detailed view doesn't show any endpoints if all connected endpoints have a green status.
Synchronized Application Control
The Synchronized Application Control widget shows details for applications discovered on Sophos-managed devices using Synchronized Security. You can see the number of New and Categorized applications as well as the total number of applications detected.
Click the widget to go to Applications > Synchronized Application Control.
Zero-day protection
Zero-day protection requires a subscription. Click the link in the control center to start your free 30-day evaluation.
The Zero-day protection widget shows details of files and incidents detected by Zero-day protection. Zero-day protection is a cloud-based service that provides enhanced protection against malware. You can configure the firewall to send suspicious downloads to Zero-day protection for analysis. When you turn on Zero-day protection, it prevents users from downloading files that match the criteria set in the firewall until the analysis is complete. Zero-day protection runs files to check for ransomware and other advanced threats. Because the analysis takes place in the cloud, your system is never exposed to potential threats.
The widget shows the following counters:
- Recent: New threat reports for files scanned by Zero-day protection that are malicious, suspicious, or potentially unwanted applications (PUA) in the last seven days.
- Incidents: Shows the number of files detected by Zero-day protection that are marked as malicious, suspicious, or PUA. Incident reports are retained for up to six months. Go to Report settings > Data management to change this setting.
- Scanned: Shows all traffic detected by Zero-day protection, including files marked as clean. The time period covered is only limited by the retention period for entries in the database.
Click the widget to go to Zero-day protection > Downloads and attachments.
Active threat response
The Active threat response widget shows a snapshot of compromised network hosts and threat events based on Managed Detection and Response (MDR) threat feeds, NDR Essentials, Sophos X-Ops threat feeds, and third-party threat feeds.
You can see the following information in the widget:
- MDR: Shows the status and the number of blocked threats using MDR threat feeds.
- Sophos X-Ops: Shows the status and the number of blocked threats using Sophos X-Ops threat feeds.
Click Configure to protect your network from threats.
User Threat Quotient (UTQ)
The UTQ widget shows the user accounts at risk based on their browsing activity over the past seven days. Click the widget to see the users and their threat score on Reports > Dashboards.
The firewall shows UTQ using the following statuses:
![]() There are no users with risky browsing behavior or using infected hosts.
There are no users with risky browsing behavior or using infected hosts.
![]() The number of users who account for 80 percent of the risk to the network.
The number of users who account for 80 percent of the risk to the network.
SSL/TLS connections
In the SSL/TLS connections widget, you can see the details of SSL/TLS connections, including decrypted traffic, traffic that isn't decrypted, and failed connections. By clicking on the widget, you can see error types based on websites, users, and IP addresses and exclude specific websites from decryption. Decryption details are updated every five minutes.
If you don't see the connection and decryption details in the control center or log viewer, turn on the following settings:
- SSL/TLS inspection rules: Go to Rules and policies > SSL/TLS inspection rules and turn on SSL/TLS inspection.
- SSL/TLS engine: Go to Rules and policies > SSL/TLS inspection rules > SSL/TLS inspection settings. Under Advanced settings > SSL/TLS engine, select Enabled.
The widget shows the following details:
- Of traffic: Shows SSL/TLS encrypted traffic as a percentage of total firewall traffic.
- Decrypted: Shows decrypted connections as a percentage of SSL/TLS connections.
- Failed: Shows the number of failed SSL/TLS connections. The counter resets at midnight. To manually reset the counter, hover over the SSL/TLS connections widget and click the Reset 'Failed' count button.
Click the widget to see the following additional details:
- SSL/TLS sessions during the past 24 hours
- Errors in the past seven days
- Firewall session details
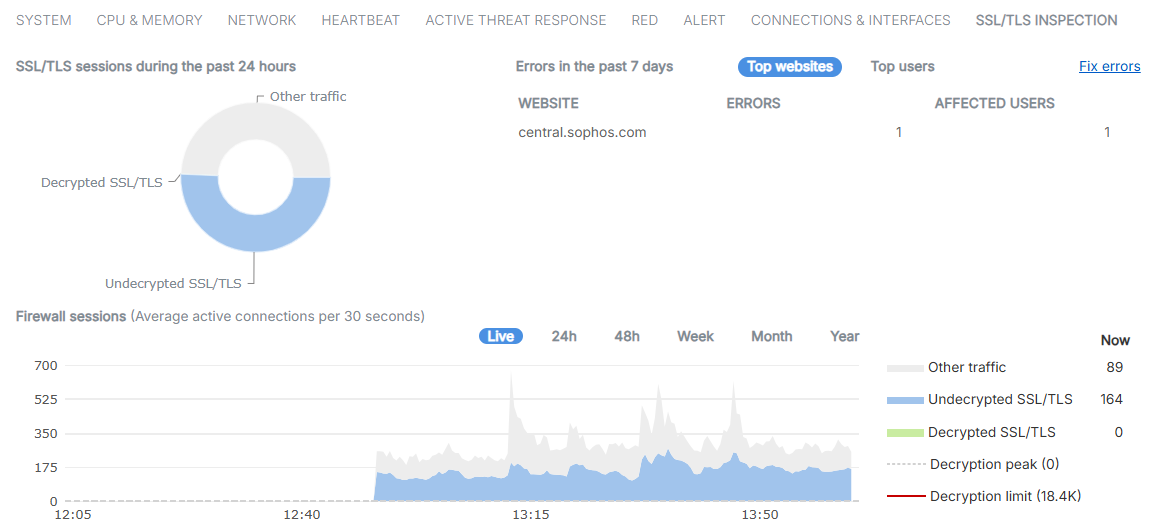
SSL/TLS sessions during the past 24 hours
The chart shows unencrypted traffic, decrypted traffic, and traffic that remains unencrypted. It doesn't include connections going through the web proxy. The chart updates every five minutes. To see the traffic details, hover over the chart.
Errors in the past 7 days
The table lists SSL/TLS errors by the top websites and top users or IP addresses that initiated the connection. Use this to identify issues, such as websites that don't work well when SSL/TLS traffic is intercepted. Go to Rules and policies > SSL/TLS inspection rules to resolve the issues with policy changes. Decryption errors update every five minutes.
Top websites shows the number of errors and users for each website. To see the details, select the website. To see the error logs, click the corresponding number under Errors.
Top users shows the number of errors for each user. To see the details, select the username or IP address. To see the error logs, click the corresponding number under Errors.
Click Fix errors to open the SSL/TLS errors in the past 7 days pop-up window. This window shows the error types by website and user. You can hide or show the websites and users. To prevent errors, you can exclude the related websites from decryption. You can select Top websites or Top users.
-
Select Top websites to resolve errors by website. Select a website to see the error type and the affected users and IP addresses. You can take the following actions:
- Use the search bar to search for specific websites.
-
Click the error number for an error type or affected users and IP addresses to see the logs.
This action opens the logs in a pop-up window, which is filtered to only the relevant items. You can see the website details in the Server name column.
-
Click Hide from website error list to remove the website from the list.
- Click Show hidden to show websites that are hidden from the list. You can click Unhide from user error list to show these users and IP addresses again.
-
Click Exclude from decryption to exclude the website from decryption.
Click Add domain or Add subdomain to add the website to the Local TLS exclusion list URL group. To edit the Local TLS exclusion list, go to Web > URL groups.
-
Select Top users to resolve errors by user or IP address. Select a user or IP address to see the error type and the affected websites. You can take the following actions:
- Use the search bar to search for specific users or IP addresses.
-
Click the error number for an error type or affected website.
This action opens the logs in a pop-up window, which is filtered to only show the relevant items. You can see the website details in the Server name column.
-
Click Hide from user error list to remove the user or IP address from the list.
- Click Show hidden to show users and IP addresses that are hidden from the list. You can click Unhide from user error list to show these users and IP addresses again.
To see the exclusion lists, go to Rules and policies > SSL/TLS inspection rules. Excluded websites won't show in this table after the seven-day time frame.
Note
The data shown in this section doesn't include connections going through the web proxy.
The data only includes connection errors that can be resolved by changing an SSL/TLS inspection rule, or suggest missing CA or application trust issues on user devices. It doesn't include connections blocked by a web policy or other security policies.
Firewall sessions
You can see a graph of active firewall sessions. You can select to see the graph Live or over 24h, 48h, Week, Month, or Year. The Live graph updates every 30 seconds. Other time frames update every five minutes. The graph for the 24-hour time frame matches the chart in Errors in the past 7 days.
To see the traffic details, hover over the graph.
The graph shows the following traffic categories:
- Other traffic: Unencrypted traffic.
- Undecrypted SSL/TLS: The connections that weren't decrypted during the selected period. For more details, go to Rules and policies > SSL/TLS inspection rules and check the exclusion lists and decryption profiles.
- Decrypted SSL/TLS: The number of decrypted connections during the selected period.
- Decryption peak: The maximum number of decrypted connections during the selected time. Shown only when actual traffic is close to or above this level.
- Decryption limit: The total number of connections your Sophos Firewall can decrypt. Shown only when actual traffic is close to this level.