Always use the following permalink when referencing this page. It will remain unchanged in future help versions.
https://docs.sophos.com/nsg/sophos-firewall/20.0/Help/en-us/webhelp/onlinehelp/index.html?contextId=diagnostics-system-graphs-load-average
Your browser doesn’t support copying the link to the clipboard. Please copy it manually.
Load average graphs
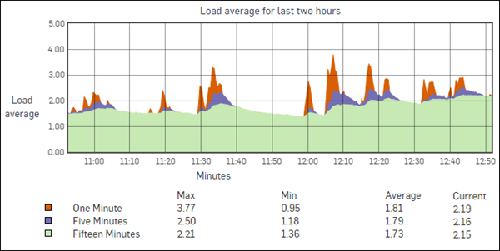
The Load average graph shows the load on your Sophos Firewall.
The x-axis shows minutes, hours, days, or months (depending on the time period selected).
The y-axis shows the load average.
Legend:
- Orange: One minute
- Purple: Five minutes
- Green: Fifteen minutes

