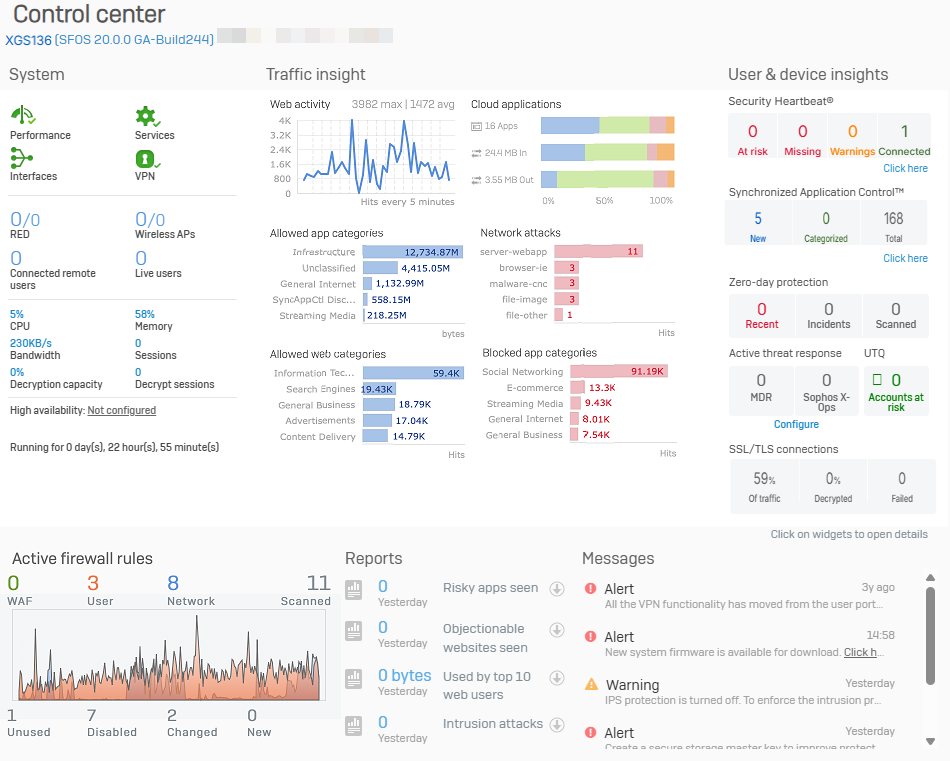
Control center
The control center shows the firewall's appliance model, firmware version, build, and serial number. It also provides a snapshot of the security system's status and health.
The control center appears as soon as you sign in.
Note
Some widget counters are reset after a firewall restart.
Secure storage master key
The secure storage master key provides extra protection for the account details stored on Sophos Firewall. The key encrypts sensitive information, such as passwords, secrets, and keys, preventing unauthorized access.
The accounts have access to services, such as directory services, email servers, FTP servers, and proxies. They also include user accounts stored on Sophos Firewall.
Set up the master key
For new installations, you must create the secure storage master key in the setup assistant.
Note
If you upgraded a firewall that doesn't have a master key to version 20.0, you must create the master key on the control center.
You can only create the master key from the control center if you sign in using the default admin account. It's the default super administrator with the username set to admin. See Default admin password settings.
Other administrators can see the alert for creating the master key on the control center, but can't create it when they sign in using their own credentials.
Reset the master key
If you lose the master key, you can use the Reset secure storage master key option on the CLI to create a new master key. This option only appears if you've created the master key. See Reset secure storage master key.
Warning
If you lose the secure storage master key, you can't recover it. Make sure you store it in a password management system or another secure location.
Backup and restore
You must enter the secure storage master key when you restore a backup taken after the master key was set. If you don't enter the master key, you can't restore these backups.
You can restore backups taken before the master key was set without entering the master key.
See Secure storage master key.
Import export
Currently, sensitive information, such as user passwords, Wi-Fi access point secrets, hotspot vouchers, and SPX users are encrypted.
You can import configurations that have a master key without entering the secure storage master key, but you'll lose sensitive information and the dependent configurations. You'll need to reenter or recreate the information later.
See Import export.
High availability
The master key is synchronized between the two HA devices in both active-active and active-passive modes. The master key continues on a standalone device and on both devices when you disable HA on either device. In active-passive mode, you can only set and reset the master key through the primary device.
Factory configuration
If you reset to factory configuration, the firewall removes the secure storage master key.
Default administrator's password
Sophos Firewall offers stronger password protection for the default administrator (username: admin). To benefit from the protection, you must change the password if you're upgrading from 18.0 MR3 or earlier or 17.5 MR14.
You can use one of the following options to change the password:
- Control center: Make the change in the pop-up window that appears when you sign in.
- Device access: Go to Administration > Device access, scroll down to Default admin password settings, and change the password.
- CLI: On the command line, enter 2 for System configuration, then enter 1 for Set password for user admin, and change the password.
Note
Store the current password in a secure location. If you move to an earlier firmware version that uses the current password, you'll need it to sign in.
System panel
The system panel shows the real-time status of the services of Sophos Firewall, VPN connections, WAN links, and performance, as well as the number of days that the device has been up and running. The status is shown as an icon. Colored icons are used to differentiate statuses. Click the icon to see detailed information about the services.
The icons and their meanings are as follows:
Performance
Icon | Status |
---|---|
Normal Load average is fewer than 2 units. | |
Warning Load average is from 2 to 5 units. | |
Alert Load average more than 5 units. | |
Unknown |
Click the icon to see the load average graph.
Load average is the average number of processes waiting to run on a CPU over a period of one week. Any number greater than the number of processor cores in the system indicates that, during the time period being measured, there was more work to do than the system was capable of doing.
Services
Icon | Status |
---|---|
Normal All the services are running. | |
Warning You've stopped one or more services. You can restart services on System services > Services. | |
Alert One or more services aren't running. You can restart services from System services > Services. | |
Unknown |
On clicking the icon, the services that are stopped or dead are displayed.
Interfaces
Icon | Status |
---|---|
Normal All the WAN links are up. | |
Warning 50% or fewer WAN links are down. | |
Alert 50% or more WAN links are down. | |
Unknown |
Click the icon to see details of the WAN links.
Note
Ports without an IP address assigned to them have a red status. Example: Ports assigned to VLAN interfaces.
VPN connections
Icon | Status |
---|---|
Normal All the VPN tunnels are up. | |
Warning 50 percent or fewer VPN tunnels are down. | |
Alert 50 percent or more VPN tunnels are down. | |
Unknown |
Click the icon to see details of the VPN tunnels.
RED
The widget displays the number of RED tunnels established and the total number of RED tunnels configured in the form of 4/8. Click the widget to view a list of RED tunnels.
Wireless APs
The widget displays active access points (AP) and the total number of access points configured in the form of 2/3. Pending access points, if any, will be displayed separately in a bracket in red color. Click the widget to go to the Access points page.
Connected remote users
The widget displays the total number of users connected remotely through SSL VPN. Click the widget to go to the Remote users page.
Live users
The widget displays the total number of live users. Click the widget to go to the Live users page.
CPU
CPU graphs allow you to monitor the CPU usage by users and system components. Maximum and average CPU usage is also displayed when you click the widget.
X-axis – Hours, weeks, months, or year (depending on the selected option)
Y-axis – Percentage of use
Click the widget to view details.
Memory
Memory graphs allow you to monitor the memory usage in percentage. The graphs show the memory used, free memory, and total memory available. In addition, the graphs show the maximum and average memory usage.
X-axis – selected
Y-axis – Percentage of use
Click the widget to view details.
Bandwidth
The graph displays the total data transfer through the WAN zone. In addition, it shows the maximum and average data transfer.
X-axis – Hours/days/months/year (depending on the option selected)
Y-axis – Total data transfer in Kbits/second
Click the widget to view details.
Sessions
The graph shows the current sessions of Sophos Firewall. It also displays the maximum and average live connections.
Click the widget to view details.
Decryption capacity
Decrypted SSL/TLS connections as a percentage of your firewall's decryption capacity.
Decrypt sessions
The current number of decrypted SSL/TLS connections.
Decryption details are updated every five minutes.
Traffic insight panel
The section provides statistics related to network traffic processed by your Sophos Firewall in the last 24 hours. The at-a-glance information helps find out who is consuming the most bandwidth, unusual traffic patterns, and most-visited websites and applications.
The statistics is displayed as bar graphs:
- Web activity: The graph provides the user data transfer information over the last 24 hours, which helps in understanding the web surfing trend. It also displays the maximum and average amount of data transferred, in bytes, over the last 24 hours, which helps you spot unusual traffic patterns if any. For example, if the graph displays a peak level at a certain point in time, it means the maximum amount of data transfer was done over that time period.
- Allowed app categories: The graph displays the amount of data transferred, in bytes, for the top five application categories. This information provides an administrator an at-a-glance view of the most-used applications in the last 24 hours, which helps you identify the applications that consume the most bandwidth. Click the bar of a specific application category in the graph to see the filtered application report for that category.
- Network attacks: The graph lists the top five hosts that were denied access to the network due to health reasons. Click the bar of a specific attack category in the graph to see the filtered report for that category.
- Allowed web categories: The graph displays the amount of data transferred, in bytes, for the top five web categories. This information provides an administrator an at-a-glance view of the most-visited websites in the last 24 hours, which helps you identify the websites that consume the most bandwidth. Click the bar of a specific web category in the graph to see the filtered report for that category.
- Blocked app categories: The graph displays the top five denied application categories along with number of hits per category. This information helps an administrator identify the applications with the most number of failed access attempts. Click the bar of a specific application category in the graph to see the filtered application report for that category.
User & device insights panel
Security Heartbeat
The Security Heartbeat widget provides the health status of all endpoint devices. An endpoint device is an internet-capable computer hardware device connected to Sophos Firewall via Sophos Central. The endpoint sends a heartbeat signal at regular intervals and also informs about potential threats to the Sophos Firewall.
Click Configure in the widget to configure Security Heartbeat.
The health status of the endpoint can be red, yellow, or green:
- Red labeled "At risk" - Active malware detected.
- Yellow labeled "Warning" - Inactive malware detected.
- Green (no label) - No malware detected.
- Red labeled "Missing" - Endpoints not sending health status information but causing network traffic.
When you configure Security Heartbeat, it classifies the endpoints in any of the four statuses. The Security Heartbeat widget shows the total number of endpoints for each status.
Select the widget to see all the endpoints, their user, hostname, IP address, and elapsed time since the status change. You can choose to display all or specific endpoints based on their health status.
The detailed view doesn't show endpoint details if all connected endpoints have a green status.
Threat intelligence
The Threat intelligence widget shows details of files and incidents seen by Zero-day protection. Zero-day protection is a cloud-based service that provides enhanced protection against malware. You can configure the firewall to send suspicious downloads to Zero-day protection for analysis. Zero-day protection runs files to check for ransomware and other advanced threats. Because the analysis takes place in the cloud, your system is never exposed to potential threats.
Zero-day protection requires a subscription. Click the link to start your free 30-day evaluation.
When you enable Zero-day protection, it prevents users from downloading files that match the firewall criteria until the analysis is complete.
The Threat intelligence widget displays analysis results for web and email traffic. Click the widget to view Threat intelligence activity details.
The widget shows the following details:
Counter | Description |
---|---|
Recent | New threat reports for files scanned by Zero-day protection that are malicious, suspicious, or PUA in the last seven days. |
Incidents | Shows a complete count of files seen by Zero-day protection that are marked as malicious, suspicious, or PUA. The time period covered is only limited by the retention period for entries in the database. |
Scanned | Shows all traffic seen by Zero-day protection including files marked as clean. The time period covered is only limited by the retention period for entries in the database. |
Click any counter of the widget to go to the Threat intelligence page of Sophos Firewall.
Active threat response
The Active threat response widget shows a snapshot of compromised network hosts and threat events based on Managed Detection and Response (MDR) threat feeds and Sophos X-Ops threat feeds.
Click Configure to protect your network from threats.
User Threat Quotient (UTQ)
The UTQ widget shows the user accounts at risk based on their web surfing for the past seven days. Click the widget to see the users and their threat score on Reports > Dashboards.
UTQ statuses:
No users with risky web surfing behavior or using infected hosts that are part of a botnet.
Number of users who account for 80 percent of the risk to the network.
SSL/TLS connections
You can see the details of SSL/TLS connections, including decrypted traffic, traffic that isn't decrypted, and failed connections. You can see error types based on websites, users, and IP addresses. You can exclude websites from decryption. Decryption details are updated every five minutes.
If you don't see the connection and decryption details in the control center or log viewer, turn on the following settings:
- SSL/TLS inspection rules: Go to Rules and policies > SSL/TLS inspection rules and turn on SSL/TLS inspection.
- SSL/TLS engine: Go to Rules and policies > SSL/TLS inspection rules > SSL/TLS inspection settings. Under Advanced settings > SSL/TLS engine, select Enabled.
Name | Description |
---|---|
Percentage of traffic | SSL/TLS encrypted traffic as a percentage of total firewall traffic. |
Percentage decrypted | Decrypted connections as a percentage of SSL/TLS connections. |
Failed | Failed SSL/TLS connections. The counter resets at midnight. To manually reset the counter, hover over the SSL/TLS connections widget and click the Reset 'Failed' count button. |
Select the widget to see the SSL/TLS sessions during the past 24 hours, firewall session details, and errors in the past seven days.
SSL/TLS sessions during the past 24 hours
The chart shows unencrypted traffic, decrypted traffic, and traffic that isn't decrypted. It doesn't include connections going through the web proxy. The chart is updated every five minutes. To see the traffic details, hover over the chart.
Firewall sessions
Select the time frame of the active firewall sessions. The live connection average is updated every 30 seconds. Averages for the other time frames are updated every five minutes. The graph for the 24-hour time frame matches the chart in Errors in the past 7 days.
To see the traffic details, hover over the graph.
Name | Description |
---|---|
Other traffic | Unencrypted traffic. |
Undecrypted SSL/TLS | Number of connections not decrypted during the selected period. For details of exclusions from decryption, go to Rules and policies > SSL/TLS inspection rules and see the exclusion lists and decryption profiles. |
Decrypted SSL/TLS | Number of decrypted connections during the selected period. |
Decryption peak | Maximum number of decrypted connections in the past. Shown only when actual traffic is close to or more than this level. |
Decryption limit | Number of connections your Sophos Firewall can decrypt. Shown only when actual traffic is close to or above this level. |
Errors in the past 7 days
The table lists SSL/TLS errors by the top websites and top users (users and IP addresses that initiated the connection). Use this to identify issues, such as websites that don't work well when SSL/TLS traffic is intercepted. Resolve the issues with policy changes.
Decryption details are updated every five minutes.
Name | Description |
---|---|
Top websites | Select to see the number of errors and users for each website. To see the details, select the website. To see the error logs, select the corresponding number under Errors. |
Top users | Select to see the number of errors for each user. To see the details, select the username or IP address. To see the error logs, select the corresponding number under Errors. |
Fix errors | Select to see the error type by websites and users. |
Note
The data shown in this section doesn't include connections going through the web proxy.
The data only includes connection errors that can be resolved by changing an SSL/TLS inspection rule, or that suggest a missing CA or application trust issues on user devices. It doesn't include connections blocked by a web policy or other security policies.
SSL/TLS errors in the past 7 days
The pop-up window shows the error types by websites and users. You can hide or show the websites and users. To prevent errors, you can exclude the related websites from decryption.
- Select Top websites or Top users.
- For websites, select the website to see the error type and the affected users and IP addresses.
- For users, select the user to see the error type and the affected websites.
- To view the logs of an error type, website, or user, select the corresponding number under Errors. The action opens a pop-up window that only shows the relevant items. You can see the website details under the column Server name.
-
Hide a website or user:
- Go to the website or user.
- At the bottom of the pop-up window, select Hide from website error list or Hide from user error list.
-
Show a website or user:
- Select Show hidden under the search field.
- Go to the website or user.
-
At the bottom of the pop-up window, select Unhide from website error list or Unhide from user error list.
The default websites in the exclusion lists of SSL/TLS inspection rules remain hidden.
-
Exclude a website from decryption:
- Go to the website.
- At the bottom of the pop-up window, select Exclude from decryption. You can exclude domains and subdomains.
Domains and subdomains are added to the URL group Local TLS exclusion list. To edit this list, go to Web > URL groups.
To view the exclusion lists, go to Rules and policies > SSL/TLS inspection rules.
Excluded websites won't show in this table after the seven-day time frame.
Active firewall rules
This widget shows the number of firewall rules by rule type and rule status. It shows the traffic (in bytes) that matched the firewall rules in the past 24 hours.
- To see the data volume, hover over the chart.
- To see the rules in the Firewall rule table, select a firewall rule status. The rule table sets a filter based on your selection.
All administrators, irrespective of their rights, can see the firewall rules.
Name | Description |
---|---|
WAF | Firewall rules for web server protection. |
User | Firewall rules in which users or groups are selected. |
Network | Firewall rules in which users aren't selected. |
Total | All three firewall rule types. |
Name | Description |
---|---|
Unused | Sophos Firewall looks for firewall rule usage at the end of every 12 hours. Rules whose criteria didn't match any traffic during the period are listed here. You may want to revise or delete unused firewall rules. |
Disabled | Firewall rules that are configured, but turned off. |
Changed | A firewall rule remains in this list for 24 hours from the time you've made changes to the rule. |
New | A firewall rule remains in this list for 24 hours from the time of its creation. |
Note
For short durations, rules may belong to some or all the above status lists because of the default duration for which they remain in a list. See the following example:
Rule name: Test
Rule creation: 10 AM. Test
rule is listed under New until 10 AM the next day.
Rule change: 11 AM. Test
rule is listed under Changed until 11 AM the next day.
Usage check: If Sophos Firewall performs a usage check at 12 noon, and Test
rule remains unused, the rule is listed under Unused until the next usage check.
Turned off: 1 PM. Test
rule is listed under Disabled. A disabled rule is listed under Changed and Disabled.
Reports panel
Not applicable to XG85 and XG85w models.
Depending on the modules subscribed, at most five critical reports from the below mentioned table are displayed:
Report name | Number/data displayed | Subscription module |
---|---|---|
High risk applications | Number of risky apps seen yesterday | Web Protection |
Objectionable websites | Number of objectionable websites seen yesterday | Web Protection |
Web users | Data transferred (in bytes) by the top 10 users yesterday | Web Protection |
Intrusion attacks | Number of intrusion attacks yesterday | Network Protection |
Web server protection | Number of web server attacks yesterday | Web Server Protection |
Email usage | Data transferred (in bytes) | Email Protection |
Email protection | Number of spam emails yesterday | Email Protection |
Traffic dashboard | - | Either Web Protection or Network Protection |
Security dashboard | - | Either Web Protection or Network Protection |
Messages
This widget shows alerts for system events with the date and time. The alerts include the following:
- Secure storage master key: You need to create the master key for extra protection of sensitive information, such as passwords.
- WAN access: Web admin console (HTTPS) and CLI (SSH) are accessible from the WAN zone. If you must access these from outside the network, we recommend using VPNs or creating local service ACL exception rules for specific hosts or networks.
- Registration: Sophos Firewall isn't registered.
- Licenses: Some modules don't have a license.
- Reports: The reports disk usage has reached the lower or higher threshold. We recommend you decrease the disk usage below the lower threshold. See Report summarization stops.
Note
Some warnings and alerts disappear after you complete the requirement. You can't manually delete a message.
Indicators
Name | Description |
---|---|
Alert | |
Warning | |
Available firmware versions |