Log viewer
Log viewer shows the event logs. It is automatically updated with new events.
To open it, sign in to the web admin console and click Log viewer in the upper-right corner of any page. It opens in a new full-screen browser window.
When are sessions logged
Firewall rules: The firewall logs sessions when it receives a connection Destroy event and closes the connection.
It doesn't log sessions when the connection is closed without the firewall receiving a Destroy event, such as during the loss of internet connectivity.
SSL/TLS connections: The firewall logs the connection after the handshake is complete and when it closes the connection.
How to change the view
Use the following controls to change what the log viewer shows.
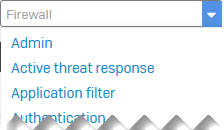
Select a module and format
Note
If you use a translated source address other than MASQ (default masquerading address), the Log viewer's standard view shows the MASQ address as the outgoing address. To see the actual translated source address, see the src_trans_ip in the detailed view.
Pause, refresh, and export logs
| Control | Description |
|---|---|
| Pause automatic refresh. | |
| Manually refresh the logs. | |
| Export logs in CSV format. |
See additional details
| Control | Description |
|---|---|
| Open PCAP | See packet information when packet capture is turned on. To configure the settings, see Display filter. |
| See identifying objects, such as usernames, IP, MAC, and email addresses when data anonymization is turned on. You must be authorized and provide your authentication credentials. | |
| Copy information to clipboard. | |
| Modify rules and policies | Modify web policies, firewall rules, or SSL/TLS rules. |
How to filter logs
You can use filters as follows:
-
Module: Select a module from the module drop-down menu.
The number of entries depends on the firewall's disk size.
-
Time: Click Timer filter and select a time option.
-
Field and value: Click Add filter and select the field, condition, and value. All the values are listed in the Syslog reference guide.
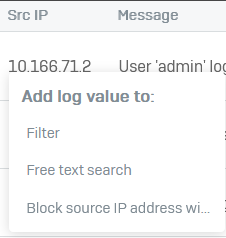
To add a value to the filter, click the value. For example, the source IP address value.
-
Free text search: Use the search field or click on a field and select Free text search. For example, you can search for ports, IP addresses, usernames, or rules. This also works with anonymized information.
To clear all filters, click Reset on the Log viewer bar's upper-right corner.


