SD-WAN performance
You can see graphs showing the real-time performance of the gateways in your SD-WAN network.
To monitor the real-time performance of the gateways, go to Diagnostics > SD-WAN performance and select an SD-WAN profile.
Alternatively, go to Routing > SD-WAN profiles, select an SD-WAN profile, and under Status, click Historical performance.
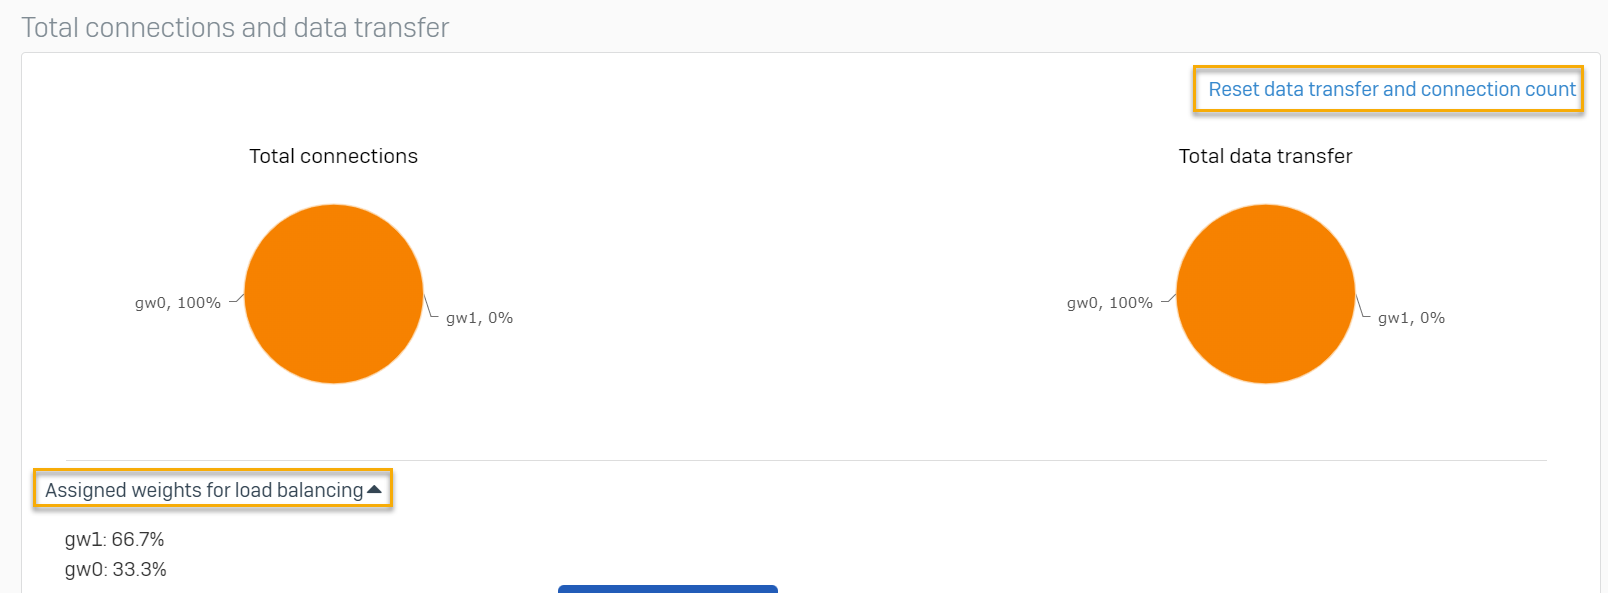
You can see graphs showing each gateway's total connections and the amount of data transferred.
You can do as follows:
- Click Reset data transfer and connection count to reset these counts.
- Click Assigned weights for load balancing to see the load-balancing weights assigned to each gateway.
Note
These graphs show No data to display if you haven't created a route using the selected profile or traffic isn't passing through the route where the selected profile is used.
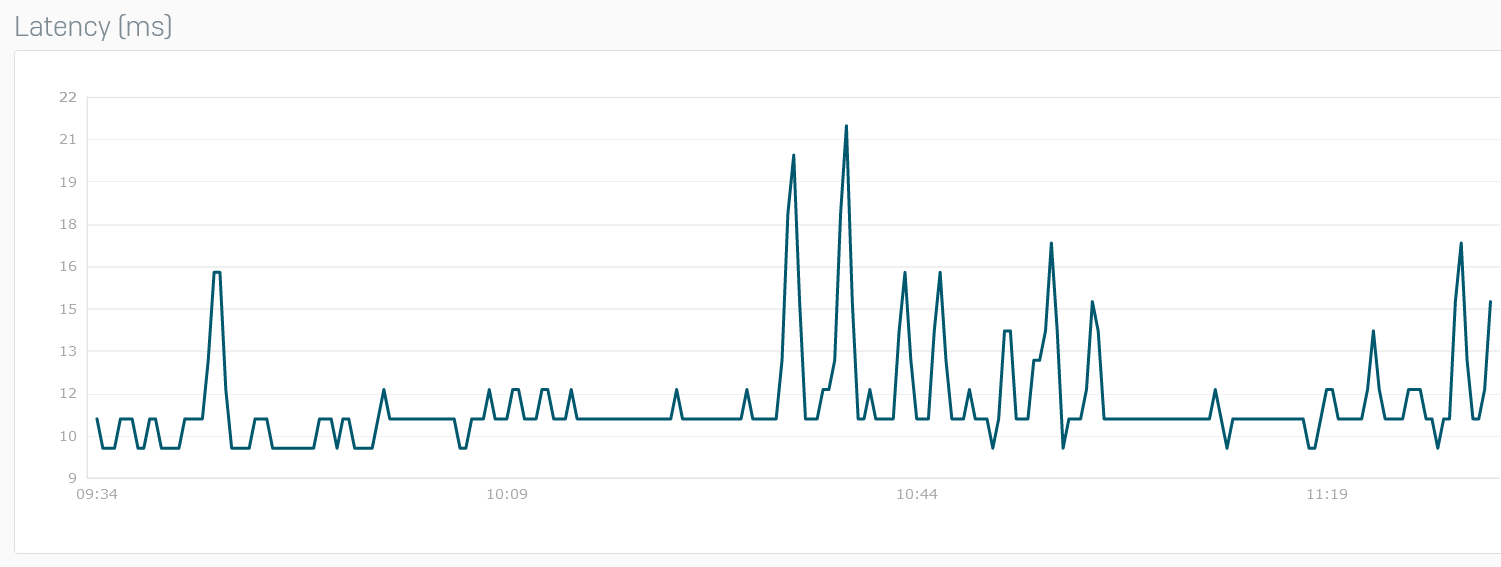
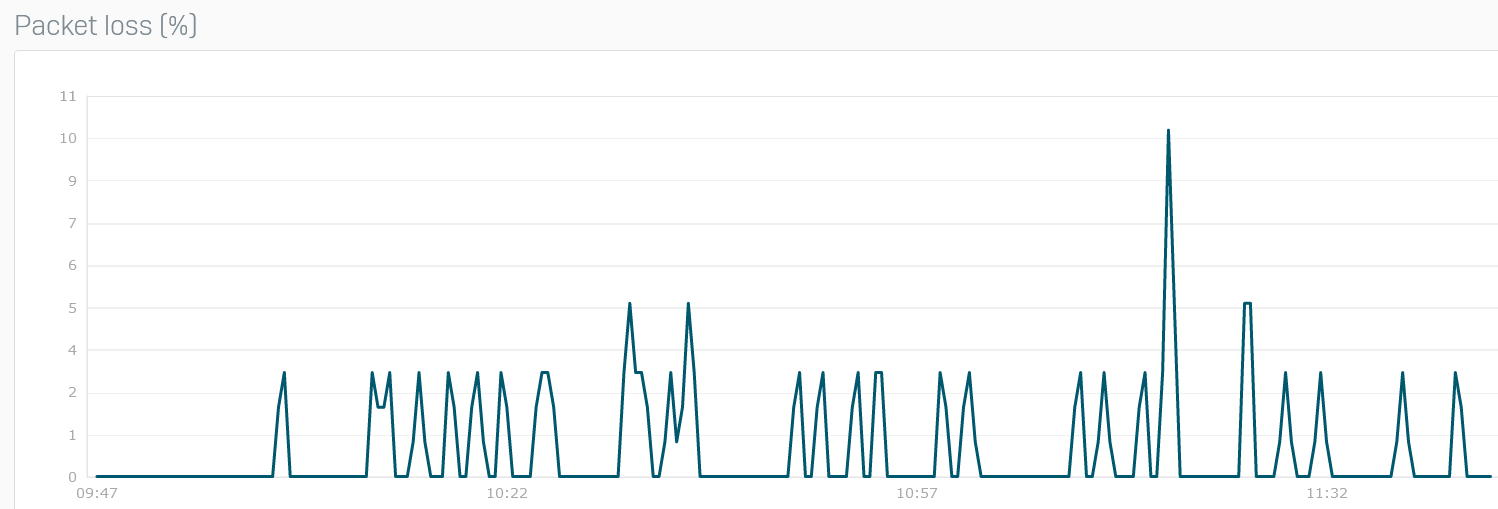
You can see graphs for latency, jitter, and packet loss for each gateway in the SD-WAN profile. You can filter the graphs by time (Live, 24h, 48h, Week, or Month).
Latency
The x-axis shows time.
The y-axis shows the latency in milliseconds.
Jitter
The x-axis shows time.
The y-axis shows the jitter in milliseconds.
Packet loss
The x-axis shows time.
The y-axis shows packet loss in percentage points.


