Data transfer speed through WAN zone graphs
There are three WAN zone graphs, which provide information about data transfer speed through the WAN zone.
Total upload and download data transfer speed
This graph shows the total upload and download data transfer speed for the selected period. It also shows the minimum, maximum, average, and current upload and download data transfer speeds individually.
The x-axis shows minutes, hours, days, or months, depending on the selected period.
The y-axis shows the upload and download data transfer speed (kbit/s).
Legend:
- Orange: Upload data transfer speed
- Purple: Download data transfer speed
Total data transfer speed
This graph shows the combined total upload and download data transfer speed from the WAN zone for the selected period. It also shows the minimum, maximum, average, and current data transfer speed.
The x-axis shows minutes, hours, days, or months, depending on the selected period.
The y-axis shows the combined total upload and download data transfer speed (kbit/s).
Legend:
- Orange color: Combined total upload and download data transfer speed
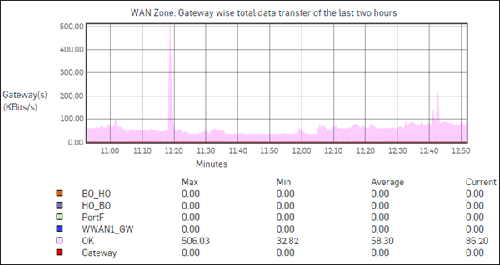
Gateway-wise total data transfer speed
This graph shows the data transfer speed for each gateway from the WAN zone for the selected period. It also shows the minimum, maximum, average, and current data transfer speed for each gateway.
The x-axis shows minutes, hours, days, or months, depending on the selected period.
The y-axis shows the upload and download data transfer speed (kbit/s).
Legend:
- Different color for each gateway
Note
The web admin console shows KBps in the graphs, but this is actually in kbit/s. This will be updated in a future release.
