Traffic insight
The Traffic insight widget shows statistics related to network traffic processed by your Sophos Firewall over the last 24 hours. This information helps identify who is consuming the most bandwidth, unusual traffic patterns, and the most-visited websites and applications.
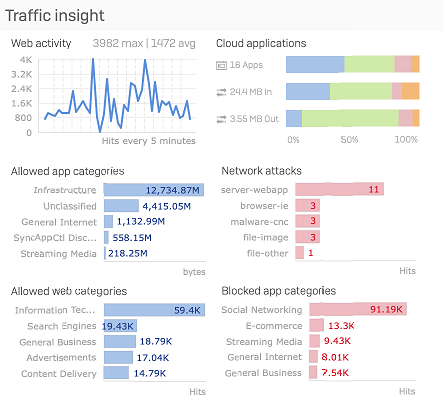
You can see the following graphs:
- Web activity: This graph shows the user data transfer information over the last 24 hours, which helps you understand the web surfing trend. It also shows the maximum and average amount of data transferred, in bytes, over the last 24 hours, which helps you identify any unusual traffic patterns. For example, if the graph shows a peak level at a certain point in time, it indicates that the maximum amount of data transfer occurred during that time period.
- Cloud applications: This graph shows information about detected cloud applications and their data transfer. You can see the number of cloud applications detected, as well as the amount of Bytes in and out. Hover over a graph to see the number of New, Sanctioned, Unsanctioned, and Tolerated cloud applications in each graph. Click a graph to go to Applications > Cloud applications.
- Allowed app categories: This graph shows the amount of data transferred, in bytes, for the top five application categories. This information provides an at-a-glance view of the most frequently used applications over the last 24 hours, helping you identify the applications that consume the most bandwidth. Click the bar of a specific application category in the graph to see the filtered application report for that category.
- Network attacks: This graph lists the top five hosts that were denied access to the network due to health reasons. Click the bar of a specific attack category in the graph to see the filtered report for that category.
- Allowed web categories: This graph shows the amount of data transferred, in bytes, for the top five web categories. This information provides an at-a-glance view of the most-visited websites over the last 24 hours, which helps you identify the websites that consume the most bandwidth. Click the bar of a specific web category in the graph to see the filtered report for that category.
- Blocked app categories: This graph shows the top five denied application categories along with the number of hits per category. This information helps yo identify the applications with the largest number of failed access attempts. Click the bar of a specific application category in the graph to see the filtered application report for that category.