Control center
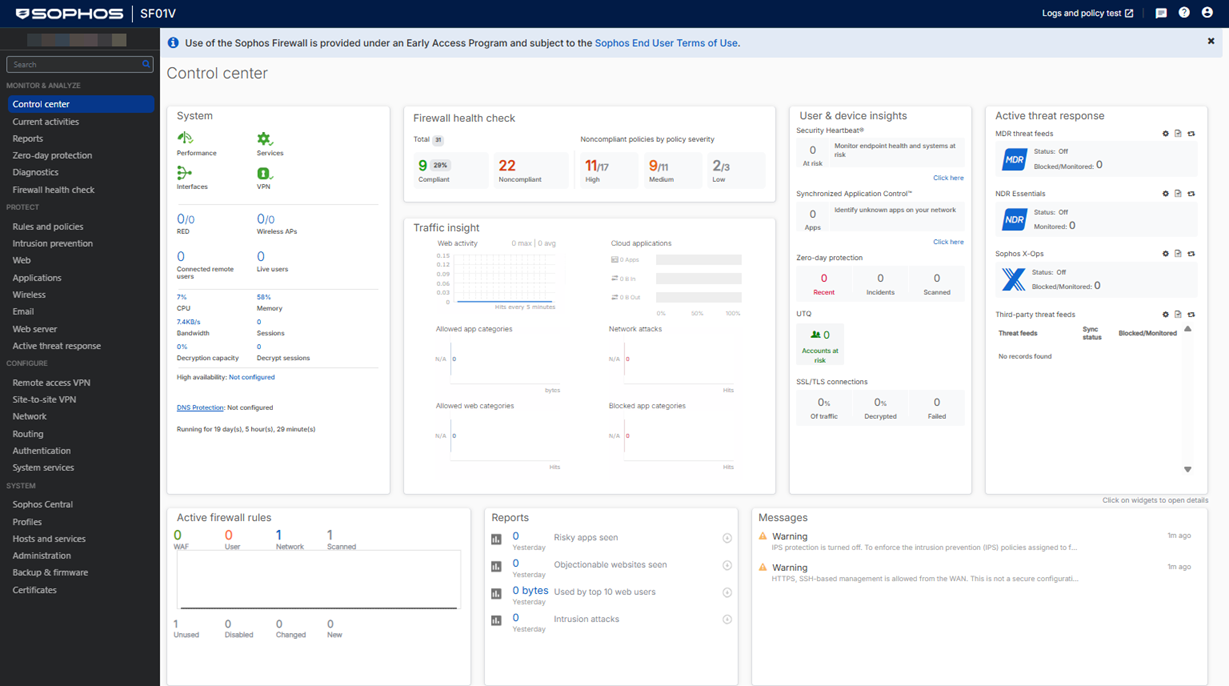
The Control center opens when you sign in to the web admin console and provides a snapshot of the firewall's status and health through various widgets. At the top of the page, you can view firewall information and access help resources. See Web admin console.
Note
The firewall doesn't show temperature information in the web admin console.
Widgets
Some widget counters are reset after a firewall restart.
-
System
See the real-time status of the Sophos Firewall services.
-
Firewall health check
See the firewall's compliance with recommended configurations, best practices, and regulatory standards.
-
Traffic insight
See statistics related to network traffic processed by your Sophos Firewall in the last 24 hours.
-
User & device insights
See security health information for your users and devices, such as Security Heartbeat, User Threat Quotient, and SSL/TLS connections.
-
Active threat response
See compromised network hosts and threat events based on Active threat response modules, such as Managed Detection and Response (MDR) and Sophos X-Ops threat feeds.
-
Active firewall rules
See the number of active firewall rules and the amount of traffic matching those rules.
-
Reports
Quickly access up to five critical reports depending on the firewall's subscribed modules.
-
Messages
See alerts for events that require action.