Logging & Reporting
This chapter describes the logging and reporting functionality of Sophos UTM.
Sophos UTM provides extensive logging capabilities by continuously recording various system and network protection events. The detailed audit trail provides both historical and current analysis of various network activities to help identify potential security threats or to troubleshoot occurring problems.
The reporting function of Sophos UTM provides real-time information of its managed devices by collecting current log data and presenting it in a graphical format.
The Log Partition Status page in WebAdmin shows the status of the log partition of your Sophos UTM unit, including information about the disk space left and fillup rate as well as a four-week histogram of the log partition utilization. As the fillup rate is the difference between the measurement point and the starting point divided by the time elapsed, the value is somewhat inaccurate in the beginning but becomes more precise the longer the system is up.
Note – Be aware that if there are too many reporting details and too much data traffic the hard disc space might get filled.
The following topics are included in this chapter:
- View Log Files
- Hardware
- Network Usage
- Network Protection
- Web Protection
- Email Protection
- Remote Access
- Webserver Protection
- Executive Report
- Log Settings
- Reporting Settings
Reporting Charts
Sophos UTM displays reporting data in line charts and pie charts. Due to their interactivity, those charts allow a fine-grained access to information.
Line Charts
Interacting with line charts is easy: When hovering the mouse cursor on a chart a big dot will appear, which gives detailed information of this part of the chart. The dot is clung to the line of the chart. As you move the mouse cursor the dot follows. In case a chart has several lines, the dot switches between them according to where you move the mouse cursor. Additionally, the dot changes its color depending on which line its information refer to, which is especially useful with lines running close to each other.
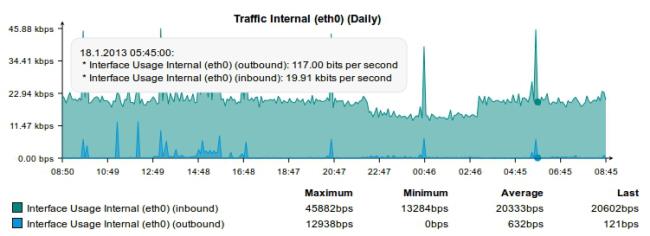
Reporting: Example of a Line Chart
Pie Charts
Similar to line charts, you can interact with pie charts: Direct the mouse cursor to a piece of a pie chart. This piece will immediately be extracted from the rest of the pie, the tooltip showing detailed information of the extracted piece.
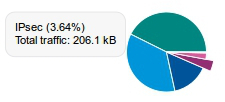
Reporting: Example of a Pie Chart