Network Visualization
Sophos Cloud Optix provides a graphical representation of your cloud environment.
Network Visualization shows high-level and detailed information about your AWS, Microsoft Azure, and GCP networks, virtual machines, and any interconnections.
For example, the high-level view for AWS will show all virtual private clouds (VPCs) in your AWS environment, and any peer connections. This helps you understand entry and exit points that may need more security.
You can click an icon to see a detailed view of a cloud environment. This shows information about major resources in your networks, including computer instances and storage databases.
Network Visualization also shows your Security Group configuration and uses flow logs to show traffic flow to and from your cloud resources.
How to get to Network Visualization
To see the different Network Visualization views, do as follows:
-
Go to Visualize, and click Network Visualization.
-
Select the environment type (for example, AWS) in the upper right of the page.
-
In Environment select the environment you want to see.
A high-level view of the selected environment appears.
-
Click a VPC to go to detail mode.
A map with one or more icons appears.
The icons represent resources in the selected VPC. You can see detailed information about the VPC in the Controls panel.
-
Click an icon to select a resource.
The Controls panel shows information about the selected resource.
Using Network Visualization
In the detail view, you can change the type of information you can see with the Controls panel.
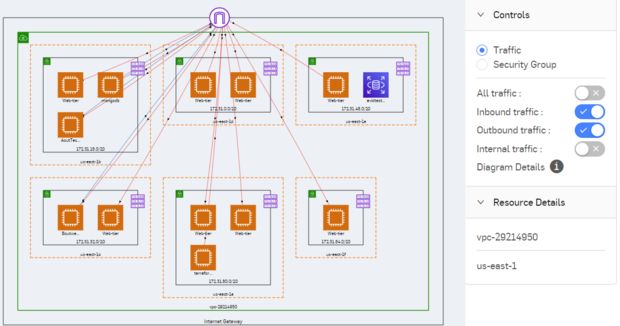
The detail view of an example AWS VPC visualization looks like this:

You can choose between two types of information to show in the control panel.
-
Click Traffic to see traffic flow recorded in flow logs.
You can see all traffic, or just the inbound, outbound, or internal traffic. The traffic lines are color-coded to help you see which type of traffic is flowing. Click the icon next to Diagram Details to see a key to the colors.
-
Click Security Group to see the traffic patterns allowed by the security groups configured in your environment.
The information displayed shows which of your resources have access to or from the public internet. This identifies areas where additional security might be useful or necessary.
You can filter the visualization by tags, security groups, instance ID, or name if you have a large network layout.
You can turn on Show inferred DBs. This uses instance metadata, traffic flow logs, and security group information to identify hosts running certain types of databases.
For AWS environments, this option is called Inferred DBs/Apps. This does the same as Show inferred DBs, and also identifies hosts running MongoDB, MySQL, and PostgreSQL databases and Elasticsearch, Logstash, and Kibana (ELK) applications.
Click the visualization export icon  to generate an SVG file of the current view.
Sophos Firewall and Server Protection integration
If you've deployed Sophos firewalls in AWS or Azure, you can see them in network visualization.
You can also see Sophos Server Protection agents that you've deployed on AWS EC2 instances and Azure VMs, and their security health status.