Interface graphs
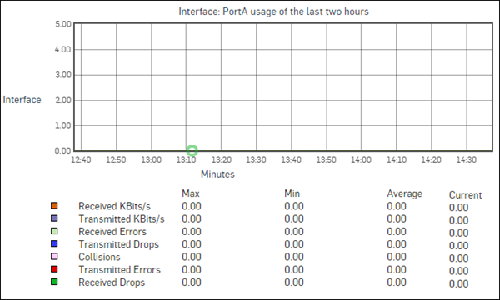
The interface graphs show traffic statistics for interfaces, including physical interfaces, wireless LAN, WAN interfaces, and VLAN interfaces in the WAN zone.
Note
Sophos Firewall only shows separate graphs for VLAN interfaces in the WAN zone. The firewall combines data for VLANs in other zones with the data for the physical interface on which they're configured.
The statistics shown are as follows:
- Bits received and transmitted through the interface
- Errors occurred while transmitting and receiving packets through the interface
- Packets dropped while transmitting and receiving packets through the interface
- Collisions occurred while transmitting and receiving packets through the interface
The x-axis shows minutes, hours, days, or months (depending on the time period selected).
The y-axis shows the kilobits per second (kbit/s).
8 Bits = 1 Byte
Legend:
- Orange: Bits received (kbit/s)
- Purple: Bits transmitted (kbit/s)
- Light green: Received errors
- Blue: Bits transmitted but dropped
- Pink: Collisions
- Red: Transmitted errors
- Dark green: Bits received but dropped
The graphs for today and yesterday are plotted at an average of five minutes.
The weekly graph is plotted at an average of fifteen minutes.
The monthly graph is plotted at an average of six hours.
The yearly graph is plotted at an average of one day.
Note
The web admin console shows KBps in the graphs, but this is actually in kbit/s. This will be updated in a future release.
