Dashboard
The Phish Threat Dashboard is the start page of Sophos Phish Threat.
Go to My Products > Phish Threat.
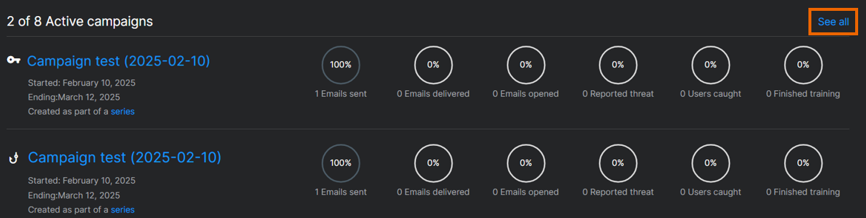
Active campaigns
The Active campaigns section shows your active or upcoming campaigns.
If you have more than two active campaigns, the two nearest to their completion date are shown on the Dashboard page. You can view all your campaigns on the Campaigns page. See Campaigns.
To view your active and upcoming campaigns, click See all.
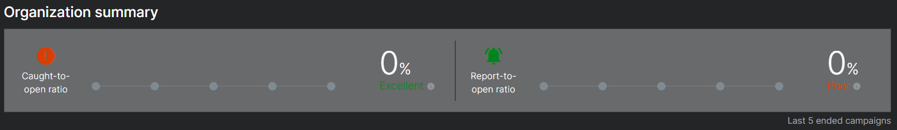
Organization summary
The Organization summary section shows the average percentage of users who were caught and average percentage of users who reported in the last five campaigns.
-
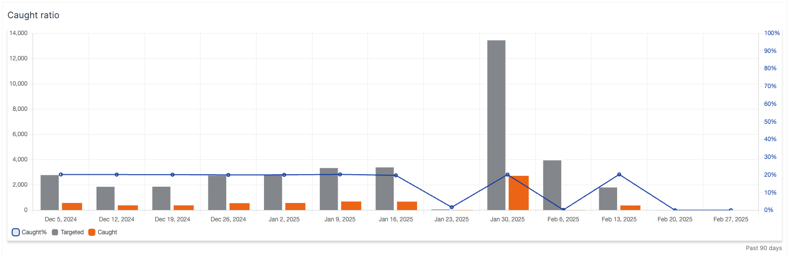
Caught-to-open ratio: Shows the number of people in your organization who got caught by a simulated attack as a percentage of the number of people who have opened the phishing emails.
You can also refer to the Caught ratio graph for a visual presentation of your caught users.
-
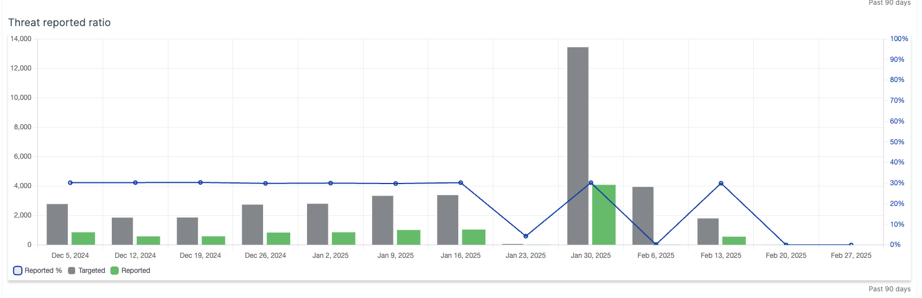
Report-to-open ratio: Shows the number of people in your organization who have reported the phishing emails as a percentage of the number of people who have opened them.
You can also refer to the Threat reported ratio graph for a visual presentation of the reported phishing emails.
Caught users
The Caught users section shows a list of people in your organization who got caught by a simulated attack. The most frequently caught users appear at the top of the list.
Threat reporters
The Threat reporters section shows a list of people in your organization who have reported phishing emails.
Awareness factors
The Awareness factors section shows four critical metrics for understanding the effectiveness of a phishing awareness program.
- Users tested: Shows you what percentage of your user base has been subjected to a phishing simulation. You should aim to test everyone at least once every three months.
- Last campaign: Helps you to see whether you're testing your users frequently enough.
- Users caught: Gives you an aggregate view of your users' fail rate in attack simulations.
- Passed training: Shows the overall completion rate of users enrolled in awareness training.
Export to PDF
You can export dashboard data and campaign reports to PDF format.
To do this, click Export to PDF.